Condition we need
As discussed before in an environment that is poised for a downturn in 6 or 12 month we want to have a trading strategy that has the following criteria.
- We want to make money when the stock market moves up moderately.
- We want to make money when the stock market moves sideways.
- We want to make money when the market goes down.
Specifics of the Setup
As outlined before the Call Spread is not that profitable as an Iron Condor and needs a little more capital but it has the following great characteristics.
- The upward risk can be determined and is limited by historical data. No market collapses to the upside and goes down at a constant rate. Just the opposite.
- The upward move of the underlaying is not a profit hindering development as long as the trend is at a moderate historical proven pace.
- The probability of being taken out can be calculated based on data sets. That level is around 5% in our method.
- This trade makes money even the stock does not move at all.
- This trade makes money when the price of the underlaying collapses. Great for an expected market crash. When all hell breaks lose you go like: YEAH, YEAH, Yummy Money!
The basic setup goes as follows.
We sell a call option at 2.5 Standard Deviation of the actual stock price.
We buy a call option further away than the first call for less money. Hence we end up with a credit. We are technically shorting the underlaying stock. We are "short".
Why are we buying another CALL when we are short? That second Call is the hedge. It limits our losses and winds down the collateral we have to come up with. We never do naked calls.

I personally do not like to call it a "Bear Call Credit Spread" but a credit spread or Call Spread because this spread makes money in a moderate uptrend, in a neutral market and in a bearish market. But not ONLY in a bearish market as the official name suggests!
Examples
Here is the IWM (Russel2000 ETF) as an example. Anyone who had bought this ETF in January would not have made any money. Why? Because the price today is the same as it was end of January, $222.

In these 8 months, THEORETICALLY, you could have sold every week a Call Spread Expiring 30 days thereafter. With a 5 years data set of weekly OHLC prices we know how much the IWM moves up and down. What is the volatility? What is the expected Gain per year in the IWM? What is the probability that the IWM moves to a certain level within 4 weeks? Is the IWM an up moving ETF or a slow moving ETF or what? We know all these data. And they are all publicly available. All of them. Ok, lets move on.
Basic math and Dollars of the Example
Assuming as the new package is set up now, we will sell every week this spread and wait for one month until it expires and so we can keep the CREDIT received upfront. 8 months to go. There is a weekly payday for the IWM. Every Friday is payday.
We can calculate 4 trades a month. We stick to the graph above. Just to use the easy numbers. You can run the details yourself.
- You need 4 x $1,850 to place a trade as collateral. This is $7,400, US Dollar in a month since this trades are rolling trades. 4 trades will be always on.
- Sell the spread for some money and never buy it back. Let it expire!! If you sold a PUT SPREAD it is more like selling insurances. You insure other traders against a huge downturn and guarantee them to buy their position for a written contract price, which will be executed if the market price is below that said contracts price.
- Selling a CALL SPREAD is more like selling lottery tickets with a certain (5%) chance of winning. Like in the Casino but you are the bank running the roulette table. After 4 weeks you let the ticket expire, like a lottery ticket. You buy it every week, no? I sell them every week to you. Run new numbers and sell a new Spread. Every week. Repeat.

- In 8 months you would have sold 8 months x 4 spreads. The credit received would have been 8 x 4 x ($162 - 7.95)= $5,000.
- Compared to the risk placed on the table, $7,400, the earnings would have been 67.6% or annualized 101.4%.
The four major ETFs
Before going deeply into the setup, lets take a look at the characteristics of the 4 major ETFs. Those are one of the most liquid ETFs on the market and hence your best chance to terminate your position in bad times.
The Qs and the IWM have the highest swing of the major ETFs. 2% and 1.8%. But when you put the days where the stock is down into calculation the ratio becomes more upward leaning for the Qs.
- For the QQQ (NASDAQ ETF) 1.1% up and 0.6% down on a weekly base.
- For the IWM (RUSSEL 2000 ETF)1.1% up and 0.97% down on a weekly base.
- The SPY (Standard and Poor 500 ETF) and the DIA (Dow Jones industrial Index ETF) run about the same. 0.85% up and 0.65% down. This is so when you incorporate the loosing days. If you invested in the S&P 500 or into the Dow Jones you would have made the same money.
- I love when the market doesnt move at all or when it crashes. I am naturally always a contrarian. Who would have thought!!!

Where do you want to be if you like neutral markets that are not going anywhere? IWM. Statistics tell you exactly what the probability is of being above the current market price and what is the probability of being below the current market price. You can also visualize what the potential losses are.
As we saw from the graph above the swings are not very shallow but have some ripples, 2% wave swings. And the towers show you how balanced the stock is or how skewed it is. The QQQ is more skewed to the upside but similar volatile, wave ripples of 1.79%, as the IWM.

Winner and Loser Examples
Here is an example of a winner and a looser. But the trades happened in the past examined with current data. Hence the line of the Standard Deviation would be slightly different, maybe turning the looser into a winner.
We see a trade entry at the worst time when the stock is down at the bottom. And then it runs against you all month long. The upper turquoise line is 2.5 SD. Add $200 to it and that is your CUT OFF. Your Strike is being hit. That's why I say it is better to wait for two "green" candles in the daily charts and calculate the levels from there. You will avoid being hit too often.
And this is the QQQ, which we already know is leaning very much to the upside. Here probably wait for 4 green candles and in the 5th daily candle sell when seem fit at daily high.
For the IWM we only let two candles pass and decide in the third. But we can wait longer since we dont want a trend. The longer we wait and the stock is moving up the more probable it becomes that it will peak and retrace and the month is over. The Spread is dead.

Here is an example of a winner.

Here again is the SETUP
- Sell IWM Call Credit Spread at 2.5 / 3.5 SD every week
- Sell IWM only.
- Sell after 2 days of Green candles in a row. Sell in the third candle at daily high.
- Set Alarm when it hits the Strike Price at 2.5 SD
- Close it if the trade is losing $200
- Otherwise dont do anything and let the cat run dead.

After Burner
I also put LONG CALL expectations together based on the same stats to see what the gain of long calls would be. Here we would go with the QQQs since they are the strongest in a trending market. But since the rumors are about that the Feds will be tapering soon we stay out of these things. The coming tapering will dive the market maybe by 25-30% and a follow up in interest rate hikes will crash the market. My numbers are 10 Year US Note Yield at 2.2% And commercial lending hitting pre-pandemic levels. BOOM and BUST. But here is the QQQ long call in an up trending market.
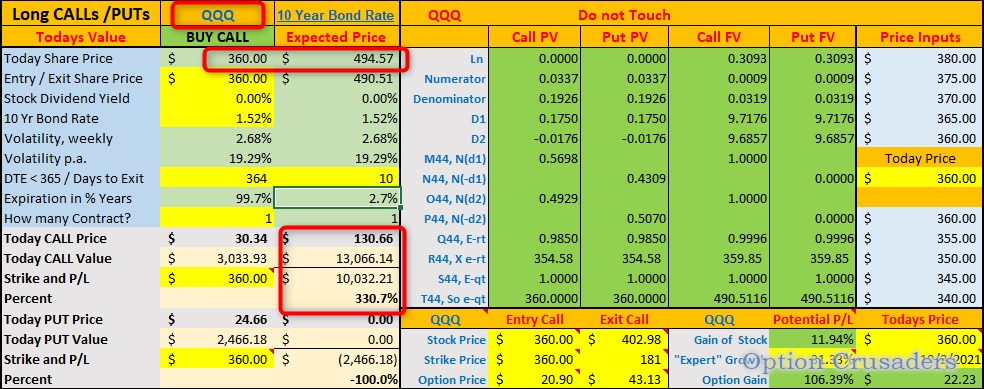
We can see that the QQQ might run up to $494 after one year according to the pricing from ETF . com and the data analysis from 5 years weekly data by me. Thus, buying a long call for QQQ with an expiration of 364 days and cashing it in during the last 10 days it is still alive, would make you pay $3,033 upfront for the contract and receiving a NET of $10,032 at selling. This is an astonishing 330% ROI!! You tripled your money. That's why nobody wants to taper and cool down the inflation since there is toooooo much money to be made. Who cares about inflation for the normal people? Nobody. Fact. And "normal" people care more about wearing the mask than how they get ripped off!


No comments:
Post a Comment