
Friday, June 10, 2022
10 Year Bond Rate is over 3% and Inverted
An inverted Treasury yield curve is one of the most reliable leading indicators of an impending recession
New Inflation Numbers out
The FED has created artificial demand and now a shortage.

New Inflation Numbers out: While loans and credit cards are full of debt consumer confidence at an all time low. I thought it
Thursday, June 9, 2022
Where is the Economy going? Up or down?
Usually a recession starts in the manufacturing sector. And when the layoffs are coming people also start to save on services. But we can see that the development in the service sector is much more dramatic. Inflation is eating everything here.
Tuesday, May 17, 2022
Wheat and Corn Shortages are Coming
And India banned wheat exports on Saturday days after saying it was targeting record shipments this year, as a scorching heatwave curtailed output and domestic prices hit a record high. The Indian Meteorological Department (IMD) defines a drought year as one in which the overall rainfall deficiency is more than 10 per cent of the long period average and more than 20 per cent of the agricultural area is affected.
Continue Reading here

Friday, May 13, 2022
Consumer Sentiment, Inflation and Market Crash
If you ever wanted to know where inflation comes from, what to do about it, and what happens if nothing is done at all or too late. This is a MUST read. You can read it in different languages including Filipino and German.

Wednesday, May 11, 2022
The Feds must Hike Interest Rates by 100 BP
The Feds must Hike Interest Rates by 100 BP: 
And if they do so the stock market will further crash. And if they do not do it, Inflation will accelerate.
A recession with high inflation is at the door step.
Tuesday, April 12, 2022
Excel Spread Sheet Statistics and the IWM
With calculating expected earning on a stock by calculating the mean profits per day for a certain term we know where we expect the price to be based on history. Now you also can only add the positive days, or for the sake of this exercise take only negative days, and we receive what I call worst case scenarios. Then we can also calculate the Average True Range of an asset and generate a 4 week price target of that. When you look at AFTER 4 WEEKS in the image we have three prices. Then we generate the average of this and have a price target where the stock SHOULD NOT BE within 4 weeks! Then we subtract the current price of the underlaying from that and we get the Deviation from the price. We then look up how many times in the past year a deviation of 18 from the price was hit within 4 weeks and calculate the probability of those occurrences. The calculated deviation of the STRIKE of the short call was hit 3.08%. This means that when you write a call option at that level your win ratio is about 97%!

Sunday, April 10, 2022
More Signs of a Recession, Short the Market
When we take a look at the past 22 years we can see when ever the 10 Year Treasury Note hit a certain level and the yield curve reversed and inverted the crisis hit. The QQQ like other ETFs dropped significantly. The reason this did not happen in late 2018 was because of the implementation the QE, Quantitative Easing, after the financial crisis. Increasing debt, is like printing money for Covid Stimmies and “Free Government Money” or excessive social programs by buying Mortgage Backed Assets and Bonds with it. This increases the Money Stock M2 and leads to inflation. Why? Because more money is chasing fewer goods. Money stock increase should only walk along GDP increase, nationally or globally for the USD. Now that the 10 Year Note is about to hit 2.4% in my opinion the chances are great to trigger the market crash we are all waiting for.

US is in a Recession - Keep Shorting the Market
But one of the most important is the INVERTED YIELD CURVE. Every time you can get more interests for short term assets than for long term assets you invert the interest curve. The only thing is that we call the interest paid on bonds and notes YIELDS. So the yield curve inverts. Below you see what I mean by that.

Tuesday, March 1, 2022
Why it is Time to Short the Market, Part 2
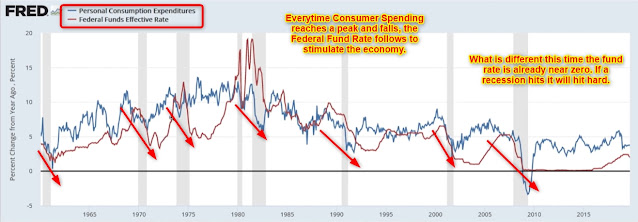
The RUBEL is about to collapse despite the selling of Foreign currencies by Russia. I am still betting on a interest rate hike by the Feds in 2 weeks due to extreme inflation, caused by the supply chain shortage on top of printing money by the federal reserve. Now the war on Ukraine has created a shortage in energy and energy prices will further inflate and might force the Feds to hike rates. We will also see that the Dear Fuhrer of Canada banned Russian oil. But he wont open the pipeline to Alberta since he wants higher oil and gas prices to push the Communist "Green" agenda. Even Biden is sanctioning the US energy sector. Public land drilling leases and fracking is banned and there is also an energy war with Alaska going on. Energy prices will go up dramatically if they dont improve production and supply. Interest rates will go up and when that happens in combination with high energy prices we might see a recession by the end of this year.
A high inflation and a stagnant economy we call STAGFLATION. This is the stage we are in already.
With inflating or dis-inflating prices, consumer will be unable to pay higher prices, inventory will rise, retail sales will drop, manufacturing orders will slow and so production. And the war on the Ukraine will accelerate this process. The GDP will stagnate too. We might slide into a recession.
Monday, February 21, 2022

Wednesday, January 19, 2022
The Crisis is about to hit
The Crisis is about to hit:
GDP Estimate for the US corrected to 5.1% for Q4, 2021.
My estimate for the GDP is 20,662 Trillion Dollars.
Monday, January 10, 2022
Acceleware mad huge new move
Acceleware made a big move since the beginning of December 2021 due to the fact that it announced that the Company has finished its drilling and completions program for the commercial-scale RF XL pilot project at Marwayne, Alberta. And we can see that the news about was published on December 14th. But the price started moving upwards beginning of December and sky rocketed on December 9th and 10th. I sold my position beforehand in October, thinking to invest it elsewhere in the meantime. My thoughts were that end of December and beginning January 2022 a position in AXE.VN should be regained since the project seemed to move smoothly forward. I was caught a little bit off guard but I still jumped in as soon as I saw the spike climbing, at 0.52 CAD. Price today, 1/10/22 is 70 cents.

Friday, December 10, 2021
Tucker: This is impossible to ignore
Inflation is here to steal your money. The CPI is a lie. All your wages going down the drain. Inflation is a monetary creation, printing money to devaluate money, to steal it.
Tuesday, November 2, 2021
IWM Market Maker Sweet Spot Calculations
How do we get to the Sweet Spot
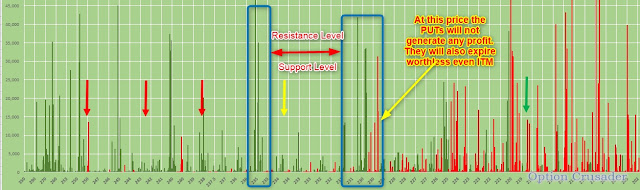
Derived from the amount of OPEN INTERESTS multiplied with 100 shares per contract times mid price gives us a good estimate what money is at stake and where the Market Maker will make the most money, or better said will lose the least! This is the spot where the market maker wants to be every Friday when there is Option Payday.
We notice that there are 1.56 Put Options for every Call option as open interests on the books. Traders are bracing for a down turn? We also see that there is a deviation between current price and sweet spot. IMO this might disappear by Friday. Market Makers will mobilizes every opportunity to get the price down. We can see that when the price came down to $224 and $226 that there are much less losses for the Market Makers. The difference is about 400 million Dollars!!
http://www.optioncrusader.com/uncategorized/iwm-market-maker-sweet-spot-calculations/
We made a mistake. Update on IWM Spread Trade
An update on IWM Call Spread. IWM reaches the frontline of defense threatening a breakthrough the all time high it reached in the beginning of March 2021 where it topped out at 234.53. Now what? Will it retread or advance?
We made a mistake.
Our calculations regarding entry level told us to enter the Spread at 248/253. But instead I entered the trade at 242/247. This is just above 1st Standard Deviation. Not good. Now I am trying to sell the wrong position for any bread crump I can get so that I can at least pay for commission and fees involved.
http://www.optioncrusader.com/trading-tactics/update-on-iwm-call-spread-november-01/

Thursday, October 28, 2021
Update on IWM Call Credit Spread, OCT/28/21
I was waiting for my two candles since Monday but the underlaying took a small retraction. Today on Thursday we saw a bullish engulfing. It was rejected at the 229-230 Resistance level. An area with over 100,000 Call and 50,000 Put options. If this level is broken the MM will have to hand out more money to the players. And this, they do not like. The Market Maker Sweet Spot is between $228 and $222. This is were I expect the price to settle for the end of this week. This is the zone where the MM make the most profit.
What do I expect tomorrow OCT 30th?

The US Economy is deteriorating further
The US Economy is deteriorating further. Now GDP estimates reach 0.2%!!! While the Bank of Canada cuts QE to damp inflation, Jerome Powell seems to be in inflation denial. What will he do?
Go Brandon, Go!

Monday, October 25, 2021
Here I try to explain why Inflation is always a problem that is created by the Central Banks and FOMC. It is not coming from “nature”. It is a manmade Inflation. Also, Shortages like Gasoline shortages are created by the regulatory and fiscal policies of the Government. You cancel all drilling activities on public land, you kill the Keystone XL pipeline, you terminate fracking, you overregulate natural gas extraction. These things were the first things the Biden Administration did when they came to power. They created shortages.
https://www.youtube.com/watch?v=aw4xygPswqo

Friday, October 22, 2021
Bear Call Credit Spread. Final Setup #5
Make sure that you understand all four previous blogs. They are fundamentally important to this trading tactics.
bear-call-credit-spread-histogram-3_20
Additions
I introduced the True Average and the Average True Range, ATR, into the equation. To calculate the True Range is easy, please look it up on the web. For EVERYTHING you need there is a exact equation somewhere in the EXCEL websites. Guaranteed. I am not providing this here. I just explain the concept in detail as a guideline.
Having the weekly TR you also can calculate the Average True Range, the ATR.
I calculate the ATR only off 4 weeks. That is the average of one month movement. It is not so much of a difference to the typical 14 day ATR but for me I want the empathize the immediate past. Do as you see fit.
These data are also collected from Yahoo and should already be part of the download.
We already calculated the Average Return per week, our Pos Avg Return, the worst case scenario of 100% uptrend! And we multiplied it with the occurrences in the data set, here 53.05% of the weeks. The amount of weeks that the underlaying is actually up by incorporating the downturns from the dataset. This is our mean average return.

Now that we have three averages, the worst case, the mean case, and the ATR I summed them all up and averaged them. This is what I call the BINGO NUMBER, in yellow circle. This is my STRIKE PRICE.
= AVERAGE(237.35 + 246.80 + 235.50)
= 239.89
So far the Bingo Number is slightly below the 2StdDev. So the Entry can be 2StdDev. If the Bingo number comes out above the 2StdDev take that as an entry.
What is the reason behind these calculations?
These calculations give us the best probable setup for our SHORT CALL Option that still makes sense for a better ROC. For the Return On Capital Ratio, the credit in relation to the collateral capital of the trade you have to come up with, we want to go as close as possible to the current price, "ATM", At The Money. This gives the highest CREDIT.
But also we want to stay as far away as possible from the current price of the underlaying, Out of The Money, OTM, to not hit the Strike. The calculated Bingo Number will be the STRIKE Price of the trade and brings Risk/Reward into balance.
All over all it stays 2 Standard Deviations away and hence has a trigger rate of about 10.7%. The ROC is about 6.5-7.5% depending on volatility and Yield Rate.

ROC Considerations.
The IWM is creating more ROC than the QQQ and the SPY. The two latter ones are close to 5% with this setup. The DIA (Dow Jones Industrial Average) runs under 2% with this setup and hence is completely excluded.
In our example we calculate ROC as
144 -(2 x 10.95) / 1,866.95 = 6.5%.
122.10 / 1,866.95 = 6.5%
Dont forget to substract 2 x FEES for the full turnaround.

With a 10% chance of getting hit and we reserve $50 for max losses per contract due to volatility and treasury yields (just close the trade at Strike Price) we have to substract this from the net ROC.
We might have
45 winners at net of $122.10, times 45 = $5,500
5 losers at 4 x $50.00, times 5 = $1,000
Net gain in one year of $4,500
The gain percentage would be 4,500 / 7,600 = 60%
If you can pull this off every hedge fund manager will hire you.
WHY?
Because your Kelly Criterion would be

Everything above 2.00 profit per Dollar is exceptional. And everything about 20% trade size is exceptional.
You are free to add any ZEROS to this game. We are not here to calculate hard numbers but to give examples and percentages.
Take a trade per week and do it 50 weeks a year! This will double your account.
Trade Entry
We enter the trade NOT to follow a trend up or down. We dont pick bottoms or tops! We try to get in, in the middle. For that reason we wait for two green (blue) candles and enter on the third day after 30 minutes of the Opening. We try to jump in on the top then, which occurs roughly at 0900-1000 NY Time. Let the rush go and try to sell at the top. Thats it! If that doesnt work out we enter anyways. Dont worry.
Why do we try to get in at the middle?
We know the swings in that stock and we calculated the deviations and when you look at the swing pattern and the technicals we see that after a few days up there are coming a few days down! These down days decay the Days To Expiration, Theta of the Option trade and hence it will have to come out from the bottom. We want to take advantage of this and further add to our odds. We want to own the bank in the casino. We are not here to play! Take a look at this image and you know what I mean.


Another reason for letting two green candles pass is that in an upward move CALLs become more expensive and hence give us a bigger credit. This is important. If you follow the stock you will notice that.
Definition of two Green Candles
- Two bull candles
- One bull candle and a gap n' crap with a doji
The third last candle was a bull candle and hence valid, the next candle was a red DOJI and it gapped open, which means there was a lot of after market trading and I count this as a bull candle for the purpose of this exercise. You want to sell into the uptrend. So we entered on the last candle.
Daily Charts

5 Minute Charts

Days to Expiration
We chose 30 DTE. I was considering 45 DTE since there is more money for a credit to get, true, but I decided for a monthly roll over and my calculations run on a 4 week base for some numbers. This is all up to ones liking.
Exit Trade
- Let the Trade expire and keep the CREDIT.
- If the trade runs against us close at Strike Price! Remember, you get the credit up front and when you are down by the total amount of your credit you are at Break Even only. This means at Strike your OPEN P/L should be negative CREDIT RECEIVED. You close and just give back the credit. There should not be any losses. Except commissions and fees.
- You might endure some losses due to volatility and yield rate. That amount might vary some from the BE.
Subscribe to:
Posts (Atom)
Featured Post
One Day before GDP Release. Whats up with the Qs?
The 28 May 365/385/315/295 QQQ Iron Condor circles between 25% and 30% P/L. If it hits 30% today I will take it off. If it waits until tom...

Popular Post
-
An inverted Treasury yield curve is one of the most reliable leading indicators of an impending recession
-
 The FED has created artificial demand and now a shortage. New Inflation Numbers out : While loans and credit cards are full of debt consumer...
 -
 The truth hurts and offends . Most people haven't realized it yet but they have the most information and in excess of all information ...
