Thursday, September 30, 2021

Current Market Conditions and how to Trade Simple Options. Part 3/3

If you havent read the blog before do it now before trying to understand any of the following. 

Read Theory and Resources first.

Basic Trade Characteristics to consider

  • A Bear Call Credit Spread is a trade that consist of two trades. One short call and one long call. We sell a Call for a credit at a calculated level, the Short Call, and hedge this position with a Long Call further away from the short call price. We receive an instant credit for the selling of the call and pay a debit for the call we buy. The further out Call we buy is cheaper than the credit we receive for the first one. Thats why it is a credit spread.
  • This is so to not selling a naked call, which would require a lot of collateral capital in your account. Our collateral is limited to the width of the spread times the number of contracts times 100 minus credit received, basically.
  • The Bear in the name indicates that we want the market to go down, bearish, or stay ranging, neutral, or even with our setup having a moderate price increase.
  • If you would sell a Bull Put Credit Spread at the same time you would create an Iron Condor. Even then having 4 legs in the trade, this trade would be cheaper! Why? Because one side would balance out the other side. Only one side can be loosing, the other side will win. The price cannot be in two location at the same time at closing in our universe. Thats why it only considers the excess of the collateral capital.
  • An IC will decay over time and and lose value and hence makes you a profit. If it expires worthless the better for you.
    An IC has to stay within a certain range and that would be fine with us since we also would calculate the standard deviations of the Put Spread. BUT, BUT, BUT in face of potential tapering a drop in the market might just shoot the Condor. And that would not be great. 
    The condor will fall out of the sky.
  • For that reason we have to accommodate more collateral capital per trade and we will make less profit and, most importantly, a Call Spread can run negative until it expires in a market that moves up. Keep this in mind.
  • This is from OptionsProfitCalculator.com.

  • Also consider that with increasing volatility both, call option prices and put option prices go up and a spread sold in an low volatility environment might turn negative in a more volatile environment. Thus, do not try this option trade with very volatile stocks.
  • Thats why best is to sell Call Spreads in an up moving market. You get more for your money and since already a few days of upwards move have happened the possibility of having a few more down turns during the life of the option increases, too. Good for us.
  • Lets take a look at the collateral Capital you need to have in place. We chose an example of two contracts. Do how it fits your money management.
    If you would do this as an IC it would get you three times the credit but as I said in these times of potential tapering I will play it safe.


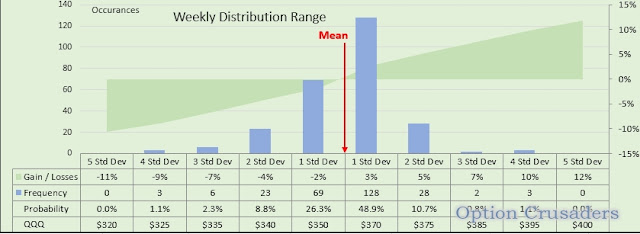
  • Lets take a look at the distribution of the QQQ. You see how big the wins or losses are at certain StanDevs, how often they occur and what the probability is to be hit. This is all calculated as described in the first blog about it. Just more fancy looking in my world. If you love it you covert it into a science.


Now lets look at the table with the StanDev. Remember, first we filtered out all returns in the spread sheet GREATER THAN ZERO. This is the number in the red circle. This happens in 160 data sets out of 262 = 5 years weekly. This is the WORST CASE SCENARIO for an uptrend based on data from the past 5 years. Why I take 5 years only and not 10 or 20? I want the set to be more leaning to the current market behavior. So I exclude the other years.

Now that the average return of 1.89% happens only in 61.07% of all 262 weeks we have to multiply it with 61.07%. We get the mean Avg Return of 1.158%. The yellow circle. The first number tells you how the market would gain if there were NO negative days or weeks or mixes. The second number takes this into consideration and pretty much draws a straight line from one month to the next. This is like calculating the angle of a trendline.


  • The AVG Median UP Trend is calculated per the weekly 1.158% gain
    The AVG Worst Case UP Trend is calculated per weekly 1.896% gain
    What we see right from the get go is that the worst case scenario is $12 above the Median Up Trend!!The next level up for a short entry is $380. And that is sitting between the 2nd Standard Deviation and the third!! That this will get hit is a probability of 10%.


  • This is our SHORT CALL ENTRY at $380
    The hedge for the LONG CALL will go $10 above at $390 and there you have it.

  • Bringing back the table with the P/L over time from OptionsProfitCalculator.com and see how to establish Stops. I keep my stop loss levels in my head. I dont like to put them out as a stiff snapping trap. Also options are derivatives of an underlaying and hence not follow straight lines as you will see. Anyway. 
  • Lets assume your Stop will calculate for a $200 loss in any trade. Your BOOK VALUE will be $180 and your MARKET VALUE would be -$380. You received a credit up front and losing that would not be a loss! You just pay it back. So your BE point would be at a MARKET VALUE of -$180.
    In this image see the RED LINE in the SAND. You can see that a moderate increase in the Stock price will not make you lose the trade. If the price doesnt move at all you win, if the price of the underlaying falls, you win. This trade just does not like hasty spikes.


  • Thats pretty much it.
    Set these trades up on Tuesdays or Wednesdays and let them run until they expire. Do this weekly. Run a mental SL at minus $200 minus $180 and close it. It is a number game. Like the bank in a casino. 
  • In OptionsProfitCalculator.com the details give this trade a 21% of success. In my calculations we have around 10%. Either way take the more conservative number of 20%.
    This means, in our example here, you will lose 4 out of 20 trades. Lets calculate the 20% loss on 20 trades for 20 weeks for this stock alone.
    • You need about $8,000 to play this game, 4 weeks = 4 running trades
    • you might win 16 trades at $180 = 2,880 minus fees
    • you might lose 4 x $200 = $800
    • Net could be 2,080 minus fees
    • The P/L would be about 10% per trade but a trade only lasts 4 weeks each.
    • Hence the annualized return would be around 116%
  • If you choose to close the trade at 50% level you could write a rule that you are allowed to open a new trade if the Stock Price varies by 2% OR you have 2 days of green candles. Remember we do not chase a trend. We want a flat or bearish market!
  • Another scenario to think about is that you could buy another long CALL at the BE line, minus $180, to accommodate for the losses if that might occur. If for whatever reason the stock retreats again and leaves your spread in the money, ITM, and your newly bought Call OTM, you can later also turn it into a credit spread. Thats the beauty of option trading.

Current Market Conditions and how to Trade Simple Options. Part 2/3

If you havent read the previous article yet you should do this before reading this one. Only if you understand the first article you will understand this setup here. 

Economic Sentiment and Chaos

There should be three conditions for any trade in this environment.

  1. The risk of an huge market down turn is real and hence we do not want to be exposed to a down turn at all. 
  2. The upside risk is less since up markets can be predicted with Statistical data and hence we can mitigate that risk by applying data for entry points and exits. A market will not explode entirely and collapse slowly. It is just the opposite.
  3. The market might trend sideways, trading up and down in a range or not moving at all. Our trade should make money in any of this cases as well.

What am I talking about? The magic wand for trading?

There are trade setups that do exactly what I just described as conditions. I am talking about Option Credit Spreads in general but here specifically of Bear Call Credit Spreads, or in short a Vertical Call or Call Spread with a credit. We sell first and then dont buy it back later. That's the fundamental idea. And if certain conditions appear we sell high first and buy it back later lower if P/L reaches 50%.

How do we mitigate if the trade goes against us?

You buy a call at the Red Line, Last Line of Defense. Or we let it expire for a loss and use The Bank of a Casino as a guideline. These trades are 80% successful.

Data collection and basic conception of wisdom

Here you must do some research on it. I urge you to do that since otherwise you will lose. Guaranteed. You swim with sharks. You intend to do Bird Watching in Lions country. You intend to serve tea and cup cakes in a battle field. Be prepared. I was just an electrician and I could learn it as a boomer. Here we go:

  • Get HISTORICAL DATA for SPY and QQQ, which I am trading, both or simply one of them. At finance.yahoo.
    Data of the past 5 years. weekly, download *.CSV
  • Load them into Excel. Create a column for RETURNS, calculate
  • FILTER all data for average in gains greater than zero. Write down the percentage. Write down the number of weeks. Same for lesser than Zero. This will be our WORST CASE SCENARIO in an uptrend. The average of a weekly gain over 5 years and NO retracement!! The market only moves up scenario.
  • Run DATA ANALYSIS and do a DESCRIPTIVE STATISTICS
    • You will receive the mean out of your data input (RETURNS) aka as excepted return for professional investors.
    • You will receive the STANDARD DEVIATION


  • Now create 1. and 2. and 3. and 4. Standard deviation for the up side and down side


  • This data goes into DATA ANALYSIS and HISTOGRAM. The INPUT RANGE will be RETURNS and BIN RANGE will be a vertical column of the standard deviations just created. BIN RANGE = INTERVALS. Chose an OUTPUT RANGE. It is BIN in the image. Then calculate Wins and losses and probabilities. See the histogram as graph below.


  • Now you have all deviations and can calculate the price tag of the underlaying.


  • The histogram will also give the percentage of probability for a certain price level to be reached. That is IMPORTANT!! Here the Histogram as a graph in Excel.


  • And here the visualization of the weekly data curve with deviations and current price.


  • There you have it. It took me about 1,000 hours to set it all up and calculate. Now it takes me 10 minutes to determine the trade parameters.
  • I know I tend to over complicate things but I am meticulous in those things. You have to dive into this statistic thing deeply. The only way to understand the machines, the ALGOS, or just paddle with them. You cannot beat the market.
  • To learn all about Options I went to Tastytrade DOT com. They have a huge site about options and all the concepts explained for free. Great stuff.
  • Then I found and took a course at ITPM with Anton Kreil. Stock Trading Master Classes. ITPM DOT com. Here you learn to use Excel and Statistics. All of it. It helped me a lot. It made me create all those sheets. I am not associated with any of those brokers or educators. 95% are charlatans.
The next article will be about the setup.


Wednesday, September 29, 2021

AMC Update September, 29

The Army of the Apes seems to recede and long term speculators are taking the spot.

Beside that the average volume sunk below 50% from end of August the daily trading is now only about 30% of that. 30 million daily trades compared to 176 million average trades on August 25th. But at the same time the put trading volume increased from 32% to 0.68%. It seems the bears are gearing up. On Tuesday there were slightly more puts traded as calls. The ratio was 1.02!!!

The option trading volume reaches about 330,000 contracts and with it the IV Ranking dropped to 30% from its value end of August of 23%. I want to say it is 7.4% now. This is the reason why my 37 PUT is still not in profit at $35 even it is ITM

The DTC, Day to Cover, also increased from 0.5 in August to 1.1 now. But this number IMO is understated due to the fact that DTC is calculated from the average trading volume and this is in a steady decline. This number is not correctly calculated in many sites.
“It is essential to remember that the short interest ratio and short interest are not the same. Short interest measures the total number of shares that have been sold short in the market”, Investopedia DOT com.
I think the real number is around 2 days since the daily trading volume never reached the average volume since end of August and is in steady decline. And the short float is pretty much steady.

With the share trading volume dropping to 39 million on Tuesday and a short float of slightly above 97 million shares (a slight increase from 96 million) the Short Ratio stands at 248%!!! This means that there are about 2.5 times more short sellers in the market than the whole amount of traded shares, which is 39 million

This is not the Army of Apes. Why is this?

The apes buy short term, one week and max 2 week options. We see an increase in the Day To Expiration terms:

On the Put side

  • 42 PUT 171 DTE
  • 42 PUT 80 DTE
  • 38 PUT 115 DTE
  • 35 PUT 80 DTE
  • 34 PUT 80 DTE
  • A massive wall of 27 PUT 171 DTE with about 9,000 contracts
  • 24 PUT 80 DTE with about 1,000 contracts, minor level
  • 24 PUT 171 DTE
  • 23 PUT 115 DTE

On the Call side

  • 145 CALL 80 DTE with about 37,000 contract
  • 145 CALL 115 DTE with about 95,000 contract
  • 120 CALL 80 DTE
  • 120 CALL 115 DTE
  • 110 CALL 115 DTE
  • 100 CALL 290 DTE
  • 100 CALL 479 DTE
  • 95 CALL 80 DTE
  • 80 CALL 479 DTE
  • 75 CALL 479 DTE
  • 50 CALL 290 DTE
  • 45 CALL 115 DTE
  • 40 CALL 171 DTE

This shows me that the long term speculators are digging in knowingly that AMC will not rise before a major dip if at all. My most outstanding call trade is a 100 CALL expiring January 23, 2023 with 2,126 contracts. Price Tag 2.126 million Dolla. Well, good luck!

After all this being said the MM Sweet Spot stays the same for now and that AMC is trading below it indicates a lot of downward pressure. But we will see where AMC settles on Friday. I would not be surprise if AMC made a 4 dollar race to 39. 


Tuesday, September 28, 2021

Current Market Conditions and how to Trade Simple Options. Part 1/3

Preface

I was thinking a lot about this what I am going to lay out here. I have done it in  the past but also differently. What am I talking about?

The question is how to continue trading with the feel that the market will have a huge pullback coming up. 

  1. Last week and this week the markets dropped twice by 5% the NASDAQ (QQQ) and 3.5% the S&P500 (SPY).
  2. We have longer than expected inflation and it will stay at raised levels.
  3. We have a slowing economy and employment numbers.
  4. The Delta variant is threatening to close the economy again
  5. Israel might attack Iran for building the nuclear bomb
  6. China might attack Taiwan
  7. Consumer confidence is lower than at the out break of the pandemic.
  8. Labor shortage and 10 million open jobs
  9. The Feds are buying bonds to keep the yields low like never before.
  10. The Feds are buying Mortgage backed securities like never before.
  11. Home prices soaring to new highs
  12. Banks are sitting on too much money and have to lend it out.
  13. The US economy is financed by debt like never before.
  14. Chinese debt and housing bubble and/ or crisis. Chinas Energy Crisis.

What will be the impact.

  1. Number 1 can be a sign that institutions are starting to roll over their positions or staying out of the market. Uncertainty.
  2. Higher inflation go hand in hand with higher asset prices, the stock market.
    Many borrow money to invest into the stock market until it crashes.
  3. This item should lead to lower prices and hence less inflation but since the Feds are pumping money into the circulation commodities and asset prices  will inflate.
  4. If this item #4 will continue to be a bigger problem the Feds will continue to print money, driving stocks higher and so inflation for consumer and producer. This will then create STAGFLATION. Slowing economy but higher prices!!
  5. This #5 will have the same impact as 4. Crazy and uncertain times require the Feds to print money.
  6. The same as 5
  7. Shows stress at consumer level which was about 90% accurate in the past. The University of Michigan Consumer Sentiment Index.
  8. This is not a result of monetary policies what the Feds do, but this is result of fiscal policies what the Trump and now the Biden administration does. Paying people for staying home and deleting small businesses.
  9. Drives inflation and stock prices higher and higher. The total value of all traded companies on the New York Stock exchange is measured by the Wilshire 5000. It gets compared to the GDP as a ratio. This is the Buffet indicator. It is at 239% of the market cap. this means 91% above the historical exponential trendline. This is significant. The market as a whole is strongly overvalued. Something has to give.


  10. Buying mortgage backed securities has 3 major effects.
    It eases the lending requirements for residential and commercial real estate buyers. It shoves the risk to the Feds in bundled asset classes
    It also more and more increases the percentage of bad apples in these bundles since at a given point in time the banks will run out of good or better clients.
    Third but not least, When the Feds start to taper the banks will tighten their risks, hence increase their Prime rates to balance the risk. Mortgages will become more expensive and cool off the housing and construction market
  11. Here bankruptcies and default are in the forecast.
  12. Cash is a liability for banks. They must lend out, no matter what. They will load themselves up with increasing risks, which will come to the forefront as soon as tapering will start. It will have a massive impact. HELOCs, LOCs, Mortgages, etc.
  13. Companies with a high debt to equity ratio and a current ratio of under 1 might have difficulties paying their premiums and /or getting financing due to tightened lending rules, interest rate hikes and soaring inflation. Companies will default. Their market cap is part of the equation and when the institutional traders divert their capital out of the stock market into bonds the crash will be here. Thats why the Feds will keep buying MBS and bonds to keep the yield down and the banks happy.
  14. A financial crisis in China will effect the US but not much. Almost all lenders are not US banks. 
Thus, this is my brief take on the situation. Follow me on Twitter, watch all images on HedgingStocks.blogspot DOT com

Conclusion

  • With all this being said I firmly believe after talking to many and doing research, running Excel spread sheets and graphs, with the scenarios of Israel on Iran, China on Taiwan, Delta on the US, US on China /Korea War, a slowing economy ----> the money printing will continue and hence the market will go up.
  • With an increasing inflation and when everybody will see that it is NOT a transitory one but a permanent one, then, we run the risk of an continuing inflation.
    • Firstly due to shortages and bottle necks like sea ports.
    • Secondly due to increased commodity prices and manufacturer input costs.
    • Thirdly due to labor and wage increases, which is part of the COGS item.
    • Fourthly and most importantly, due to money printing, which results in slowing the M1V and MV2 velocity and at the same time increasing the money stock, M1 and M2. More money for the same amount of goods inflates money.
  • Increasing inflation will force the monetary policies of the Feds to take action and taper. Tapering will slow down the banking system, slow down the economy as a whole. Tapering will reduce bond prices due to lower demand (Feds not buying) and hence the yield rate will go up. Institutions will start to transfer money out of the stock market!
  • When the Feds will start hiking interest rates the process of draining the stock market will accelerate. 
  • Tech stocks, cyclical stocks and meme stocks will fall first. Defensives stocks and staples later. A crashing stock market will bring the necessary correction. I would not be surprised to see a 40% correction in the market, the average of the past corrections we had. I would think that we see a deep correction when the yield rate hits 2.2% because the time of cheap money is over and when commercial and industrial loans have reached pre-pandemic levels at 1,600 billion Dollars.


What's next?

Under the same title I will set up the right kind of trade for a crashing market or a dipping market, or a not trending market. Options are the word. But this will be explained in the next article.


Monday, September 27, 2021

Is the Sttock Market Dooms Day approaching?

Is DOOMS DAY approaching when the 10 Year Yield reaches 2.2% and Commercial and Industrial Loans pass over the peak of April 2020 at 1,600 Billion Dollar? Interest Hikes will default companies that are heavily invested in Long Term Debt and having a Current Ratio of less than 1. This will collapse the Market.

Will the SPY drop be the average of the past? 33% And the QQQ = 41%


Wednesday, September 22, 2021

AMC Update September 22, 2021

Tuesday and Wednesday in AMC we had a PUT to Call Option Trading of 66.6% More Puts were traded than usual. 

The average trading volume is down by 50% compared to August 25th. Share trading is around 50 - 60 million and this is not enough to drive the price up. On August 31 we had 127 million trades and that drove the price up to $47! On August 25 trading volume was 208 million shares and that drove the price the price down by 1.33% to $43. I would bet if the current trading volume doesnt more than double, like 130 million or so, AMC will not go any higher. The DAYS TO COVER was 1.8 days at that point and evaporated to 0.9 days.

The current SWEET SPOT OF THE MARKET MAKER is between $39 - $41. This is the ending price in AMC for this week IMO. I have a Put to cover this weekend, A short Put, at $42 Dollars. So I hope it will just be OTM, lets ask if there might be a chance to hit $42? All over all I am still short on AMC with PUTs.

Strong Resistance levels are at $45 - $46, with 15,000 Call Options, Those levels had also been stronger in the past.
Support Level is around the $38 level with about 6,500 Put contracts but all of those expire this Friday. The next level down is at $35 with under 3,000 Put contracts.

I would say I expect AMC to float back to the mid 30s next week as long as there is no new March on Rome by the Ape Army.

And as the apes play this game they only make Goldman and Sachs rich, the trade executing firm for AMC. And of course the Brokers. Play often every week and use huge bets. Good job guys. Let me know you apes who of you actually got rich in this Ponzi scheme? Let me know in the comment section 


Monday, September 20, 2021

AMC Update 9/20/21


My short position on AMC is still valid. 37 PUT 123 DTE. 

What happened before 

Remember, when AMC crossed above $40 I bought 100 shares and did the little ride up to $45. Took profit but missed the run up to $50. 

Then I sold a $42 PUT since it was ranging and created a Diagonal PUT Spread for some credit. This was a mistake! I sold the 42 but should have sold the 39! Why? The $40 level is a strong support level and hence my Put will be 2 Dollars ITM, in the money, at 40. But even I get called out on this one it is still okay. This short leg has another 11 days to live. Lets hope it will die in silence.

What's going on here?

  1. The overall average volume in AMC is dwindling and is with 93 million daily shares about at the 50% mark of what it was three weeks ago. Trading volume at lunch time NY is around 50 million. Half of the average and about 25% of what it was. This tendency is leaning downwards IMO.
  2. The Short Ratio is increasing but not because the Short volume is increasing but because the Call trading volume is decreasing! The Apes are losing interest again! Short Ratio is 60%! Up from 30% the weeks before.


  3. The Option trading volume of AMC is still at #3 in the Barchart Option Activity Score Table. But AMC reaches only 350,000 options of which were 61% Calls. The Short Ratio increased by 4%. This only speaks for the trading volume
  4. Open Interest Volume tells a more significant story. We have as of now 35,000 Put Option Open Interest and 46,700 Calls. The Call to Put Ratio is 76%. And since the volume of the Short side did not increase much, the Call volume trading decreased we see that the sentiment is turning to the down side.
  5. There will be so far 82,000,000.00 Dollars to expire this Friday or 57,000 Options contracts.
  6. I noticed that the Call Option buying volume decreased drastically. At some levels by 90%, mostly 60-75%. But this can still change if there was another March on Rome
  7. The Market Maker Sweet Spot is sitting as for now at $40-43. This is where they want to be because they have to pay out the least amount of money.
  8. The MACD is turning and indicating a confirmation of increased Put Call Ratio and weak Call buy volume.
  9. AMC is about to cross the MA 20 correlating with the $40 support level. Why MA20? Because there are 20 trading days in a month. You can say AMC is about to drop below your monthly average price. Then there is MA250 for annual average pricing and MA60 for 3-Month average and MA5 for the weekly average. Nothing else makes sense to me.
  10. We have only 7,500 Calls sitting at the $50 level. Remember that there were about 20,000 before?


Trade Management

If AMC stays below 40 until Wednesday I will have to hedge the $42 PUT by either 

  • Buying a Put at 39 for about 6 Dollars a piece (my long Puts will outrun the 42 Short Put) or
  • Selling a 45/50 Bear Call Credit Spread. But the spread between asking and Bid Price is huge showing huge volatility and the MM are taking advantage of it. To make money here it requires several units. Compare to first suggestion. Not sure yet. Is easy with the QQQs
  • Maybe both options at the same time, buy a Put, Sell a Call Spread. Goal is to collect as much money as we spend on the 42 short put.
  • If AMC stays within the Market Maker Sweet Spot I just wait for the short leg to die (expire), 11 DTE

General Thoughts

  • If you go in on a directional trade (long Call or long Put) chose a longer, 180 or more DTE.
  • Do a diagonal Spread. Lets say you buy a call with 180 DTE then also sell a Call either above your strike with little credit but no needed collateral or below your long strike for a higher credit but with collateral calculated from the width of your spread.
  • The diagonal spread will have a short leg that will expire and hence you can keep the credit and your long position is cheaper.
  • If the trade goes against you hedge it. Sell Puts or Calls for a credit Hedge with a SHORTER time frame, maybe 30 DTE or 14 or so. 
    • Turn a long Put into a Bull Put Credit Spread if your trade goes up against you
    • Turn a long Call into a Bear Call Credit Spread if your trade goes down against you
    • Sell Put spreads if your trade goes up against you
    • Sell Call spreads if your trade goes down against you 

Featured Post

One Day before GDP Release. Whats up with the Qs?

The 28 May 365/385/315/295  QQQ  Iron Condor circles between 25% and 30% P/L. If it hits 30% today I will take it off. If it waits until tom...

Popular Post