If you havent read the previous article yet you should do this before reading this one. Only if you understand the first article you will understand this setup here.
There should be three conditions for any trade in this environment.
- The risk of an huge market down turn is real and hence we do not want to be exposed to a down turn at all.
- The upside risk is less since up markets can be predicted with Statistical data and hence we can mitigate that risk by applying data for entry points and exits. A market will not explode entirely and collapse slowly. It is just the opposite.
- The market might trend sideways, trading up and down in a range or not moving at all. Our trade should make money in any of this cases as well.
What am I talking about? The magic wand for trading?
There are trade setups that do exactly what I just described as conditions. I am talking about Option Credit Spreads in general but here specifically of Bear Call Credit Spreads, or in short a Vertical Call or Call Spread with a credit. We sell first and then dont buy it back later. That's the fundamental idea. And if certain conditions appear we sell high first and buy it back later lower if P/L reaches 50%.
How do we mitigate if the trade goes against us?
You buy a call at the Red Line, Last Line of Defense. Or we let it expire for a loss and use The Bank of a Casino as a guideline. These trades are 80% successful.
Data collection and basic conception of wisdom
Here you must do some research on it. I urge you to do that since otherwise you will lose. Guaranteed. You swim with sharks. You intend to do Bird Watching in Lions country. You intend to serve tea and cup cakes in a battle field. Be prepared. I was just an electrician and I could learn it as a boomer. Here we go:
- Get HISTORICAL DATA for SPY and QQQ, which I am trading, both or simply one of them. At finance.yahoo.
Data of the past 5 years. weekly, download *.CSV - Load them into Excel. Create a column for RETURNS, calculate
- FILTER all data for average in gains greater than zero. Write down the percentage. Write down the number of weeks. Same for lesser than Zero. This will be our WORST CASE SCENARIO in an uptrend. The average of a weekly gain over 5 years and NO retracement!! The market only moves up scenario.
- Run DATA ANALYSIS and do a DESCRIPTIVE STATISTICS
- You will receive the mean out of your data input (RETURNS) aka as excepted return for professional investors.
- You will receive the STANDARD DEVIATION

- Now create 1. and 2. and 3. and 4. Standard deviation for the up side and down side


- This data goes into DATA ANALYSIS and HISTOGRAM. The INPUT RANGE will be RETURNS and BIN RANGE will be a vertical column of the standard deviations just created. BIN RANGE = INTERVALS. Chose an OUTPUT RANGE. It is BIN in the image. Then calculate Wins and losses and probabilities. See the histogram as graph below.

- Now you have all deviations and can calculate the price tag of the underlaying.

- The histogram will also give the percentage of probability for a certain price level to be reached. That is IMPORTANT!! Here the Histogram as a graph in Excel.
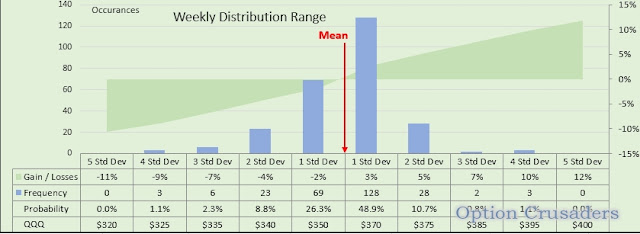
- And here the visualization of the weekly data curve with deviations and current price.

- There you have it. It took me about 1,000 hours to set it all up and calculate. Now it takes me 10 minutes to determine the trade parameters.
- I know I tend to over complicate things but I am meticulous in those things. You have to dive into this statistic thing deeply. The only way to understand the machines, the ALGOS, or just paddle with them. You cannot beat the market.
- To learn all about Options I went to Tastytrade DOT com. They have a huge site about options and all the concepts explained for free. Great stuff.
- Then I found and took a course at ITPM with Anton Kreil. Stock Trading Master Classes. ITPM DOT com. Here you learn to use Excel and Statistics. All of it. It helped me a lot. It made me create all those sheets. I am not associated with any of those brokers or educators. 95% are charlatans.


No comments:
Post a Comment