Thursday, September 30, 2021

Current Market Conditions and how to Trade Simple Options. Part 3/3

If you havent read the blog before do it now before trying to understand any of the following. 

Read Theory and Resources first.

Basic Trade Characteristics to consider

  • A Bear Call Credit Spread is a trade that consist of two trades. One short call and one long call. We sell a Call for a credit at a calculated level, the Short Call, and hedge this position with a Long Call further away from the short call price. We receive an instant credit for the selling of the call and pay a debit for the call we buy. The further out Call we buy is cheaper than the credit we receive for the first one. Thats why it is a credit spread.
  • This is so to not selling a naked call, which would require a lot of collateral capital in your account. Our collateral is limited to the width of the spread times the number of contracts times 100 minus credit received, basically.
  • The Bear in the name indicates that we want the market to go down, bearish, or stay ranging, neutral, or even with our setup having a moderate price increase.
  • If you would sell a Bull Put Credit Spread at the same time you would create an Iron Condor. Even then having 4 legs in the trade, this trade would be cheaper! Why? Because one side would balance out the other side. Only one side can be loosing, the other side will win. The price cannot be in two location at the same time at closing in our universe. Thats why it only considers the excess of the collateral capital.
  • An IC will decay over time and and lose value and hence makes you a profit. If it expires worthless the better for you.
    An IC has to stay within a certain range and that would be fine with us since we also would calculate the standard deviations of the Put Spread. BUT, BUT, BUT in face of potential tapering a drop in the market might just shoot the Condor. And that would not be great. 
    The condor will fall out of the sky.
  • For that reason we have to accommodate more collateral capital per trade and we will make less profit and, most importantly, a Call Spread can run negative until it expires in a market that moves up. Keep this in mind.
  • This is from OptionsProfitCalculator.com.

  • Also consider that with increasing volatility both, call option prices and put option prices go up and a spread sold in an low volatility environment might turn negative in a more volatile environment. Thus, do not try this option trade with very volatile stocks.
  • Thats why best is to sell Call Spreads in an up moving market. You get more for your money and since already a few days of upwards move have happened the possibility of having a few more down turns during the life of the option increases, too. Good for us.
  • Lets take a look at the collateral Capital you need to have in place. We chose an example of two contracts. Do how it fits your money management.
    If you would do this as an IC it would get you three times the credit but as I said in these times of potential tapering I will play it safe.


  • Lets take a look at the distribution of the QQQ. You see how big the wins or losses are at certain StanDevs, how often they occur and what the probability is to be hit. This is all calculated as described in the first blog about it. Just more fancy looking in my world. If you love it you covert it into a science.


Now lets look at the table with the StanDev. Remember, first we filtered out all returns in the spread sheet GREATER THAN ZERO. This is the number in the red circle. This happens in 160 data sets out of 262 = 5 years weekly. This is the WORST CASE SCENARIO for an uptrend based on data from the past 5 years. Why I take 5 years only and not 10 or 20? I want the set to be more leaning to the current market behavior. So I exclude the other years.

Now that the average return of 1.89% happens only in 61.07% of all 262 weeks we have to multiply it with 61.07%. We get the mean Avg Return of 1.158%. The yellow circle. The first number tells you how the market would gain if there were NO negative days or weeks or mixes. The second number takes this into consideration and pretty much draws a straight line from one month to the next. This is like calculating the angle of a trendline.


  • The AVG Median UP Trend is calculated per the weekly 1.158% gain
    The AVG Worst Case UP Trend is calculated per weekly 1.896% gain
    What we see right from the get go is that the worst case scenario is $12 above the Median Up Trend!!The next level up for a short entry is $380. And that is sitting between the 2nd Standard Deviation and the third!! That this will get hit is a probability of 10%.


  • This is our SHORT CALL ENTRY at $380
    The hedge for the LONG CALL will go $10 above at $390 and there you have it.

  • Bringing back the table with the P/L over time from OptionsProfitCalculator.com and see how to establish Stops. I keep my stop loss levels in my head. I dont like to put them out as a stiff snapping trap. Also options are derivatives of an underlaying and hence not follow straight lines as you will see. Anyway. 
  • Lets assume your Stop will calculate for a $200 loss in any trade. Your BOOK VALUE will be $180 and your MARKET VALUE would be -$380. You received a credit up front and losing that would not be a loss! You just pay it back. So your BE point would be at a MARKET VALUE of -$180.
    In this image see the RED LINE in the SAND. You can see that a moderate increase in the Stock price will not make you lose the trade. If the price doesnt move at all you win, if the price of the underlaying falls, you win. This trade just does not like hasty spikes.


  • Thats pretty much it.
    Set these trades up on Tuesdays or Wednesdays and let them run until they expire. Do this weekly. Run a mental SL at minus $200 minus $180 and close it. It is a number game. Like the bank in a casino. 
  • In OptionsProfitCalculator.com the details give this trade a 21% of success. In my calculations we have around 10%. Either way take the more conservative number of 20%.
    This means, in our example here, you will lose 4 out of 20 trades. Lets calculate the 20% loss on 20 trades for 20 weeks for this stock alone.
    • You need about $8,000 to play this game, 4 weeks = 4 running trades
    • you might win 16 trades at $180 = 2,880 minus fees
    • you might lose 4 x $200 = $800
    • Net could be 2,080 minus fees
    • The P/L would be about 10% per trade but a trade only lasts 4 weeks each.
    • Hence the annualized return would be around 116%
  • If you choose to close the trade at 50% level you could write a rule that you are allowed to open a new trade if the Stock Price varies by 2% OR you have 2 days of green candles. Remember we do not chase a trend. We want a flat or bearish market!
  • Another scenario to think about is that you could buy another long CALL at the BE line, minus $180, to accommodate for the losses if that might occur. If for whatever reason the stock retreats again and leaves your spread in the money, ITM, and your newly bought Call OTM, you can later also turn it into a credit spread. Thats the beauty of option trading.

Current Market Conditions and how to Trade Simple Options. Part 2/3

If you havent read the previous article yet you should do this before reading this one. Only if you understand the first article you will understand this setup here. 

Economic Sentiment and Chaos

There should be three conditions for any trade in this environment.

  1. The risk of an huge market down turn is real and hence we do not want to be exposed to a down turn at all. 
  2. The upside risk is less since up markets can be predicted with Statistical data and hence we can mitigate that risk by applying data for entry points and exits. A market will not explode entirely and collapse slowly. It is just the opposite.
  3. The market might trend sideways, trading up and down in a range or not moving at all. Our trade should make money in any of this cases as well.

What am I talking about? The magic wand for trading?

There are trade setups that do exactly what I just described as conditions. I am talking about Option Credit Spreads in general but here specifically of Bear Call Credit Spreads, or in short a Vertical Call or Call Spread with a credit. We sell first and then dont buy it back later. That's the fundamental idea. And if certain conditions appear we sell high first and buy it back later lower if P/L reaches 50%.

How do we mitigate if the trade goes against us?

You buy a call at the Red Line, Last Line of Defense. Or we let it expire for a loss and use The Bank of a Casino as a guideline. These trades are 80% successful.

Data collection and basic conception of wisdom

Here you must do some research on it. I urge you to do that since otherwise you will lose. Guaranteed. You swim with sharks. You intend to do Bird Watching in Lions country. You intend to serve tea and cup cakes in a battle field. Be prepared. I was just an electrician and I could learn it as a boomer. Here we go:

  • Get HISTORICAL DATA for SPY and QQQ, which I am trading, both or simply one of them. At finance.yahoo.
    Data of the past 5 years. weekly, download *.CSV
  • Load them into Excel. Create a column for RETURNS, calculate
  • FILTER all data for average in gains greater than zero. Write down the percentage. Write down the number of weeks. Same for lesser than Zero. This will be our WORST CASE SCENARIO in an uptrend. The average of a weekly gain over 5 years and NO retracement!! The market only moves up scenario.
  • Run DATA ANALYSIS and do a DESCRIPTIVE STATISTICS
    • You will receive the mean out of your data input (RETURNS) aka as excepted return for professional investors.
    • You will receive the STANDARD DEVIATION


  • Now create 1. and 2. and 3. and 4. Standard deviation for the up side and down side


  • This data goes into DATA ANALYSIS and HISTOGRAM. The INPUT RANGE will be RETURNS and BIN RANGE will be a vertical column of the standard deviations just created. BIN RANGE = INTERVALS. Chose an OUTPUT RANGE. It is BIN in the image. Then calculate Wins and losses and probabilities. See the histogram as graph below.


  • Now you have all deviations and can calculate the price tag of the underlaying.


  • The histogram will also give the percentage of probability for a certain price level to be reached. That is IMPORTANT!! Here the Histogram as a graph in Excel.


  • And here the visualization of the weekly data curve with deviations and current price.


  • There you have it. It took me about 1,000 hours to set it all up and calculate. Now it takes me 10 minutes to determine the trade parameters.
  • I know I tend to over complicate things but I am meticulous in those things. You have to dive into this statistic thing deeply. The only way to understand the machines, the ALGOS, or just paddle with them. You cannot beat the market.
  • To learn all about Options I went to Tastytrade DOT com. They have a huge site about options and all the concepts explained for free. Great stuff.
  • Then I found and took a course at ITPM with Anton Kreil. Stock Trading Master Classes. ITPM DOT com. Here you learn to use Excel and Statistics. All of it. It helped me a lot. It made me create all those sheets. I am not associated with any of those brokers or educators. 95% are charlatans.
The next article will be about the setup.


Wednesday, September 29, 2021

AMC Update September, 29

The Army of the Apes seems to recede and long term speculators are taking the spot.

Beside that the average volume sunk below 50% from end of August the daily trading is now only about 30% of that. 30 million daily trades compared to 176 million average trades on August 25th. But at the same time the put trading volume increased from 32% to 0.68%. It seems the bears are gearing up. On Tuesday there were slightly more puts traded as calls. The ratio was 1.02!!!

The option trading volume reaches about 330,000 contracts and with it the IV Ranking dropped to 30% from its value end of August of 23%. I want to say it is 7.4% now. This is the reason why my 37 PUT is still not in profit at $35 even it is ITM

The DTC, Day to Cover, also increased from 0.5 in August to 1.1 now. But this number IMO is understated due to the fact that DTC is calculated from the average trading volume and this is in a steady decline. This number is not correctly calculated in many sites.
“It is essential to remember that the short interest ratio and short interest are not the same. Short interest measures the total number of shares that have been sold short in the market”, Investopedia DOT com.
I think the real number is around 2 days since the daily trading volume never reached the average volume since end of August and is in steady decline. And the short float is pretty much steady.

With the share trading volume dropping to 39 million on Tuesday and a short float of slightly above 97 million shares (a slight increase from 96 million) the Short Ratio stands at 248%!!! This means that there are about 2.5 times more short sellers in the market than the whole amount of traded shares, which is 39 million

This is not the Army of Apes. Why is this?

The apes buy short term, one week and max 2 week options. We see an increase in the Day To Expiration terms:

On the Put side

  • 42 PUT 171 DTE
  • 42 PUT 80 DTE
  • 38 PUT 115 DTE
  • 35 PUT 80 DTE
  • 34 PUT 80 DTE
  • A massive wall of 27 PUT 171 DTE with about 9,000 contracts
  • 24 PUT 80 DTE with about 1,000 contracts, minor level
  • 24 PUT 171 DTE
  • 23 PUT 115 DTE

On the Call side

  • 145 CALL 80 DTE with about 37,000 contract
  • 145 CALL 115 DTE with about 95,000 contract
  • 120 CALL 80 DTE
  • 120 CALL 115 DTE
  • 110 CALL 115 DTE
  • 100 CALL 290 DTE
  • 100 CALL 479 DTE
  • 95 CALL 80 DTE
  • 80 CALL 479 DTE
  • 75 CALL 479 DTE
  • 50 CALL 290 DTE
  • 45 CALL 115 DTE
  • 40 CALL 171 DTE

This shows me that the long term speculators are digging in knowingly that AMC will not rise before a major dip if at all. My most outstanding call trade is a 100 CALL expiring January 23, 2023 with 2,126 contracts. Price Tag 2.126 million Dolla. Well, good luck!

After all this being said the MM Sweet Spot stays the same for now and that AMC is trading below it indicates a lot of downward pressure. But we will see where AMC settles on Friday. I would not be surprise if AMC made a 4 dollar race to 39. 


Tuesday, September 28, 2021

Current Market Conditions and how to Trade Simple Options. Part 1/3

Preface

I was thinking a lot about this what I am going to lay out here. I have done it in  the past but also differently. What am I talking about?

The question is how to continue trading with the feel that the market will have a huge pullback coming up. 

  1. Last week and this week the markets dropped twice by 5% the NASDAQ (QQQ) and 3.5% the S&P500 (SPY).
  2. We have longer than expected inflation and it will stay at raised levels.
  3. We have a slowing economy and employment numbers.
  4. The Delta variant is threatening to close the economy again
  5. Israel might attack Iran for building the nuclear bomb
  6. China might attack Taiwan
  7. Consumer confidence is lower than at the out break of the pandemic.
  8. Labor shortage and 10 million open jobs
  9. The Feds are buying bonds to keep the yields low like never before.
  10. The Feds are buying Mortgage backed securities like never before.
  11. Home prices soaring to new highs
  12. Banks are sitting on too much money and have to lend it out.
  13. The US economy is financed by debt like never before.
  14. Chinese debt and housing bubble and/ or crisis. Chinas Energy Crisis.

What will be the impact.

  1. Number 1 can be a sign that institutions are starting to roll over their positions or staying out of the market. Uncertainty.
  2. Higher inflation go hand in hand with higher asset prices, the stock market.
    Many borrow money to invest into the stock market until it crashes.
  3. This item should lead to lower prices and hence less inflation but since the Feds are pumping money into the circulation commodities and asset prices  will inflate.
  4. If this item #4 will continue to be a bigger problem the Feds will continue to print money, driving stocks higher and so inflation for consumer and producer. This will then create STAGFLATION. Slowing economy but higher prices!!
  5. This #5 will have the same impact as 4. Crazy and uncertain times require the Feds to print money.
  6. The same as 5
  7. Shows stress at consumer level which was about 90% accurate in the past. The University of Michigan Consumer Sentiment Index.
  8. This is not a result of monetary policies what the Feds do, but this is result of fiscal policies what the Trump and now the Biden administration does. Paying people for staying home and deleting small businesses.
  9. Drives inflation and stock prices higher and higher. The total value of all traded companies on the New York Stock exchange is measured by the Wilshire 5000. It gets compared to the GDP as a ratio. This is the Buffet indicator. It is at 239% of the market cap. this means 91% above the historical exponential trendline. This is significant. The market as a whole is strongly overvalued. Something has to give.


  10. Buying mortgage backed securities has 3 major effects.
    It eases the lending requirements for residential and commercial real estate buyers. It shoves the risk to the Feds in bundled asset classes
    It also more and more increases the percentage of bad apples in these bundles since at a given point in time the banks will run out of good or better clients.
    Third but not least, When the Feds start to taper the banks will tighten their risks, hence increase their Prime rates to balance the risk. Mortgages will become more expensive and cool off the housing and construction market
  11. Here bankruptcies and default are in the forecast.
  12. Cash is a liability for banks. They must lend out, no matter what. They will load themselves up with increasing risks, which will come to the forefront as soon as tapering will start. It will have a massive impact. HELOCs, LOCs, Mortgages, etc.
  13. Companies with a high debt to equity ratio and a current ratio of under 1 might have difficulties paying their premiums and /or getting financing due to tightened lending rules, interest rate hikes and soaring inflation. Companies will default. Their market cap is part of the equation and when the institutional traders divert their capital out of the stock market into bonds the crash will be here. Thats why the Feds will keep buying MBS and bonds to keep the yield down and the banks happy.
  14. A financial crisis in China will effect the US but not much. Almost all lenders are not US banks. 
Thus, this is my brief take on the situation. Follow me on Twitter, watch all images on HedgingStocks.blogspot DOT com

Conclusion

  • With all this being said I firmly believe after talking to many and doing research, running Excel spread sheets and graphs, with the scenarios of Israel on Iran, China on Taiwan, Delta on the US, US on China /Korea War, a slowing economy ----> the money printing will continue and hence the market will go up.
  • With an increasing inflation and when everybody will see that it is NOT a transitory one but a permanent one, then, we run the risk of an continuing inflation.
    • Firstly due to shortages and bottle necks like sea ports.
    • Secondly due to increased commodity prices and manufacturer input costs.
    • Thirdly due to labor and wage increases, which is part of the COGS item.
    • Fourthly and most importantly, due to money printing, which results in slowing the M1V and MV2 velocity and at the same time increasing the money stock, M1 and M2. More money for the same amount of goods inflates money.
  • Increasing inflation will force the monetary policies of the Feds to take action and taper. Tapering will slow down the banking system, slow down the economy as a whole. Tapering will reduce bond prices due to lower demand (Feds not buying) and hence the yield rate will go up. Institutions will start to transfer money out of the stock market!
  • When the Feds will start hiking interest rates the process of draining the stock market will accelerate. 
  • Tech stocks, cyclical stocks and meme stocks will fall first. Defensives stocks and staples later. A crashing stock market will bring the necessary correction. I would not be surprised to see a 40% correction in the market, the average of the past corrections we had. I would think that we see a deep correction when the yield rate hits 2.2% because the time of cheap money is over and when commercial and industrial loans have reached pre-pandemic levels at 1,600 billion Dollars.


What's next?

Under the same title I will set up the right kind of trade for a crashing market or a dipping market, or a not trending market. Options are the word. But this will be explained in the next article.


Monday, September 27, 2021

Is the Sttock Market Dooms Day approaching?

Is DOOMS DAY approaching when the 10 Year Yield reaches 2.2% and Commercial and Industrial Loans pass over the peak of April 2020 at 1,600 Billion Dollar? Interest Hikes will default companies that are heavily invested in Long Term Debt and having a Current Ratio of less than 1. This will collapse the Market.

Will the SPY drop be the average of the past? 33% And the QQQ = 41%


Wednesday, September 22, 2021

AMC Update September 22, 2021

Tuesday and Wednesday in AMC we had a PUT to Call Option Trading of 66.6% More Puts were traded than usual. 

The average trading volume is down by 50% compared to August 25th. Share trading is around 50 - 60 million and this is not enough to drive the price up. On August 31 we had 127 million trades and that drove the price up to $47! On August 25 trading volume was 208 million shares and that drove the price the price down by 1.33% to $43. I would bet if the current trading volume doesnt more than double, like 130 million or so, AMC will not go any higher. The DAYS TO COVER was 1.8 days at that point and evaporated to 0.9 days.

The current SWEET SPOT OF THE MARKET MAKER is between $39 - $41. This is the ending price in AMC for this week IMO. I have a Put to cover this weekend, A short Put, at $42 Dollars. So I hope it will just be OTM, lets ask if there might be a chance to hit $42? All over all I am still short on AMC with PUTs.

Strong Resistance levels are at $45 - $46, with 15,000 Call Options, Those levels had also been stronger in the past.
Support Level is around the $38 level with about 6,500 Put contracts but all of those expire this Friday. The next level down is at $35 with under 3,000 Put contracts.

I would say I expect AMC to float back to the mid 30s next week as long as there is no new March on Rome by the Ape Army.

And as the apes play this game they only make Goldman and Sachs rich, the trade executing firm for AMC. And of course the Brokers. Play often every week and use huge bets. Good job guys. Let me know you apes who of you actually got rich in this Ponzi scheme? Let me know in the comment section 


Monday, September 20, 2021

AMC Update 9/20/21


My short position on AMC is still valid. 37 PUT 123 DTE. 

What happened before 

Remember, when AMC crossed above $40 I bought 100 shares and did the little ride up to $45. Took profit but missed the run up to $50. 

Then I sold a $42 PUT since it was ranging and created a Diagonal PUT Spread for some credit. This was a mistake! I sold the 42 but should have sold the 39! Why? The $40 level is a strong support level and hence my Put will be 2 Dollars ITM, in the money, at 40. But even I get called out on this one it is still okay. This short leg has another 11 days to live. Lets hope it will die in silence.

What's going on here?

  1. The overall average volume in AMC is dwindling and is with 93 million daily shares about at the 50% mark of what it was three weeks ago. Trading volume at lunch time NY is around 50 million. Half of the average and about 25% of what it was. This tendency is leaning downwards IMO.
  2. The Short Ratio is increasing but not because the Short volume is increasing but because the Call trading volume is decreasing! The Apes are losing interest again! Short Ratio is 60%! Up from 30% the weeks before.


  3. The Option trading volume of AMC is still at #3 in the Barchart Option Activity Score Table. But AMC reaches only 350,000 options of which were 61% Calls. The Short Ratio increased by 4%. This only speaks for the trading volume
  4. Open Interest Volume tells a more significant story. We have as of now 35,000 Put Option Open Interest and 46,700 Calls. The Call to Put Ratio is 76%. And since the volume of the Short side did not increase much, the Call volume trading decreased we see that the sentiment is turning to the down side.
  5. There will be so far 82,000,000.00 Dollars to expire this Friday or 57,000 Options contracts.
  6. I noticed that the Call Option buying volume decreased drastically. At some levels by 90%, mostly 60-75%. But this can still change if there was another March on Rome
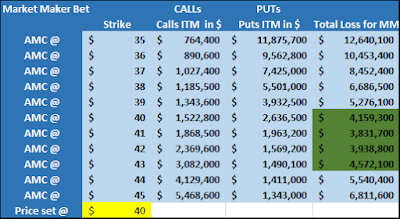
  7. The Market Maker Sweet Spot is sitting as for now at $40-43. This is where they want to be because they have to pay out the least amount of money.
  8. The MACD is turning and indicating a confirmation of increased Put Call Ratio and weak Call buy volume.
  9. AMC is about to cross the MA 20 correlating with the $40 support level. Why MA20? Because there are 20 trading days in a month. You can say AMC is about to drop below your monthly average price. Then there is MA250 for annual average pricing and MA60 for 3-Month average and MA5 for the weekly average. Nothing else makes sense to me.
  10. We have only 7,500 Calls sitting at the $50 level. Remember that there were about 20,000 before?


Trade Management

If AMC stays below 40 until Wednesday I will have to hedge the $42 PUT by either 

  • Buying a Put at 39 for about 6 Dollars a piece (my long Puts will outrun the 42 Short Put) or
  • Selling a 45/50 Bear Call Credit Spread. But the spread between asking and Bid Price is huge showing huge volatility and the MM are taking advantage of it. To make money here it requires several units. Compare to first suggestion. Not sure yet. Is easy with the QQQs
  • Maybe both options at the same time, buy a Put, Sell a Call Spread. Goal is to collect as much money as we spend on the 42 short put.
  • If AMC stays within the Market Maker Sweet Spot I just wait for the short leg to die (expire), 11 DTE

General Thoughts

  • If you go in on a directional trade (long Call or long Put) chose a longer, 180 or more DTE.
  • Do a diagonal Spread. Lets say you buy a call with 180 DTE then also sell a Call either above your strike with little credit but no needed collateral or below your long strike for a higher credit but with collateral calculated from the width of your spread.
  • The diagonal spread will have a short leg that will expire and hence you can keep the credit and your long position is cheaper.
  • If the trade goes against you hedge it. Sell Puts or Calls for a credit Hedge with a SHORTER time frame, maybe 30 DTE or 14 or so. 
    • Turn a long Put into a Bull Put Credit Spread if your trade goes up against you
    • Turn a long Call into a Bear Call Credit Spread if your trade goes down against you
    • Sell Put spreads if your trade goes up against you
    • Sell Call spreads if your trade goes down against you 

Thursday, August 26, 2021

AMC update 8/25/21 and Why do I choose options as level indicators?

I was impressed that the Ape Army could actually gather enough apes to initiate a March on Rome. They had more success than expected. But as I said, if they can gather the needed trading volume, above average, for at least 2-3 days they can drive the price above $40. And that is what they did. on last Monday they traded 260,000 option contracts and on Monday and Tuesday they traded 1 million and 1,2 million respectively. Look at the "Open Interests". These are the levels.

The funniest trade I saw was the buying of the $80 Strike long Calls with expiring this Friday. The price they paid for 9,700 contracts was about $800,000. Quiet a pricy bet.

Why do I choose options as level indicators?

If you following option trades on a daily base you can establish which options are bought and how many at which levels. You also know where the Market Maker Sweet Spots are. You also can see kind of into the future by determine how many options are bought with a longer term and at which levels. Those levels disappear with expiration date. Not all but many. And you can see what the sentiment is by comparing the Call to Put Ratio over weeks and which options have a longer term. You will see the turning point.

For example, AMC walked through the $40 level on Tuesday. The $40 level was a ceiling /resistance level with a lot of Call options. Now, while with shares I do not know where people set their Stop Loss, or Take Profit, with options I know their Strike Price and open interest volume since they are derivatives. Knowing for every call contract there are 100 shares, and assuming there are logical and psychological levels where people put their SL or TP points I further assume those levels are identical. They are increments of 5 or 10 points depending on the price of the underlaying. But thus I can determine if
a level is strong or weak. And 40 Is a strong level.

Conclusion

As soon as AMC broke 40 I knew this level was of importance. Right now there are about 20,000 call contracts counting 2 million shares. And the shares trading volume on my platform indicated.

I converted my 21 January long Puts into diagonal Spreads by selling Puts at $37 Strike to receive a credit. This short put is expiring on September 24th.

So, i dont think AMC will close below 40 this week. I bought 100 shares, went long. Lets see if the Apes will eat the bait.

Today, Thursday 26th, trading volume of AMC waned at New York lunch time. It is sitting at 32% and it seems the steam is out.

Tuesday, August 24, 2021

The Battle of AMC, Tuesday 8/24/21

Today the Ape Army gathered momentum and drove the price higher. 

The average share trading volume was surpassed by 30% and reached 225 million shares. At the same time over 1 million options contracts changed hands. 75% of which were call options and 25% put options. AMC was traded  at a volume today as almost all last week. This is impressive. Since the options are all over the place I do not give credit to any institutional money. These were traded by retail traders.

Did uncle Joe hand out all the stimulus checks already?

If the apes want to press forward they have to continue the pressure and surpass the average daily trading volume. This is what I said all along. And here they come.

The levels are:

At the $40 we have around 20,000 Call contracts with about 2 million shares.

At the $45 we have about 8,000 Call option contracts sitting. These two levels existed already yesterday and might just have changed hands. The open interest contracts didnt change.

The Apes increased their presence at the $50 level from 2,000 to almost 10,000 contracts. Then they laid some weaker levels all the way up to the heavy $80 resistance level. Here we have about 15,000 contracts sitting. 

There are about half as many open interest in Put options out there than Call options.

The Put Options, support levels, are at $37 with about 9,000 open contracts and then at 32 (6,000) and 31(4,000).

The Sweet Spot for the Market Maker sits at 35-38. Since the price of the underlaying is sitting at $44 I can say the pressure to the upside is quite high. Otherwise the MM would have dropped the price right back into the range. They couldnt do it. There are about 107,000,000 contracts to expire this Friday with an estimated value of 200,000,000.00 Dolas.

The apes loaded the $80 Resistance level with some smarter call options. They paid more and bought some time to stay longer in the game. From the 15,000 contracts about 10,000 will expire this Friday and 5,000 next Friday. Also this storm will go by.


Consequences.

My 21 January Puts sitting at $37 evolved from long Puts into a short Straddle with different expiration dates. The Puts I sold with the same strike but different DTE. Thus if the price stays above $37 until September24 that would be just great. Why?

For selling the puts my position is hedged and the potential losses with AMC trading above $40 now, received a credit, which makes up for the negative book value. So, there is no loss to my position wherever the market wants to go. Its fine with me. Even if it drops below 37-35 my long put will eat all the losses of the short put. 

First I thought of selling them at $38 or 39 but I pressed the button too quickly. Thus, it became a straddle instead of a Strangle. I like more to strangle. LOL

In the technicals of the daily charts we can also see that MACD is crossing over and SMA 5 and 20 are also crossing. I believe that the apes will take that as an initiative to drive the price up this week. I am fine with this. 

In the long run I still believe in a decline of AMC. This company is not worth a penny.


Friday, August 20, 2021

What to do in the next 6-9 months with existing risk factors?

Educate yourself to come to a conclusion.

Do not blindly follow "experts". In the current situation we are facing several risks to the stock market. I listened to a lot of so called experts. They tell you what sounds great, what you want to hear. Most of them get paid for being on the show even it is a ZOOM call without pants. They talk anything and get paid. Do they do any research or do they collect opinions off FB and Twatter? My experience is stop listening to background noise. Improve your own skills and do research and LEARN economics and financials. The Market commentary will always be totally diametric. As a seller of an asset in a trade and the buyer of the same asset have both diametric expectations of the market. So find your own.

There are a few good YouTuber out there I listen regularly in but even though I like them and they put positive thoughts into my head do not trade what they say. You can take the idea but you MUST do your own research. It is said that any stock pick of an "expert" is as good as letting a chimpanzee chose any trades. The outcome for the Chimps is better by a bit.

If you killed your account in the process come back and let me know how it worked out. Or after you lost your first account of $20,000.00 and you got up again, we can talk about your baptizing. All good traders lost a huge amount of money before they made it right. 

Having said this I can only encourage people to get financially literate. Brokers and charlatan educators rigging against you. They make huge money and you lose 90% of the time 90% of your money within 90 days.

I listed the risk factors already. This is only my personal opinion.

What factors could that be.

  • Inflation
  • Wage Inflation
  • Money Supply
  • Money circulation
  • Housing bubble
  • The Warren Buffet indicator
  • China Regulations
  • China Currency Manipulation
  • China Delta Variance of Covid the huge wild card!
  • WE MUST ADD WAR WITH CHINA to the equation, Taiwan

And I wrote about a few of them.

  • Inflation
  • Wage Inflation
  • Money Supply
  • Money Circulation
I made a research on the housing market and if we are in a bubble that is about to burst. I do not think so for the near future. But this is a very long analysis with lot of graphs that made me conclude that the housing bubble will NOT be the IED, not the roadside bomb that will bring the market down.
My biggest candidates for now are
  • The China Delta Variance of Red Covid 19 the huge wild card!
  • Chinas potential attack on Taiwan.
  • Inflation and hence the start of tapering by the Feds.

For those reasons without explaining them any further I want to explain my perspective and the focus of my trades for the next six month.

I concluded that

  1. The down side risk is growing and buying dips is getting too risky. I am closing my long positions slowly.
  2. Tapering might start October and being announced in September during the FOMC Two-day meeting in September 21-22. 
  3. This will take money out of the stock market and put it into the Bond Market. It will increase YIELDS and decrease Bond Prices. 
  4. The FOMC said that they will start tapering with both, reducing the artificial demand for bonds and MBS. 
  5. MBS, Mortgage Backed Securities are basically mortgages of smaller banks that their head quarters put together in a DEBT security and sold them to the FEDs. This is a 12 billion Dolla business per month increasing the debt burden of future generations. The banks convey the default risk to the Feds /tax payers and some interest from the mortgages. The original bank keeps a portion but very little risk. If the Feds stop buying those MBS they will give the risk back to the local banks and they will have to tighten their lending rules to reduce the increased risk of defaulting. Also this will reduce revenue with the loss of selling those MBS. Financial sector will cool down during tapering.
  6. The Bond market will cool down too. Yields will rise. The Feds will reduce buying Bonds and hence the prices will fall. Since the prices of these assets are falling their yield (state guaranteed interest rate) will increase. When the yield of an assets stays the same but you pay less than face value of that asset then your yield goes up. The yield /(interest) is NOT bond to the selling price of that asset but to the face value printed on that NOTE or BOND. Thats why it is said when the Feds keeps buying bonds it keeps the prices artificially high, they are manipulated, to keep the yield down. And of course the smart money goes into the stock market. There is much more to make. Got it? 

    Here is the 10 years Bond yield 

  7. The Stock Market will crash in a conflict with China. Foreign countries will take their money out of China stocks and the Asia region and flee to the US Dollar buying bonds. This bond buying might counter the yield a little. But all transactions will be conducted in USD. A conflict with China will shock the Asian markets.
  8. An conflict with China will force the Feds to print more money to finance war efforts, especially if they continue over a longer period of time. It will put additional pressure on inflation during and after the war. A smaller regional conflict will not have a huge impact, as we experienced already. See image.
  9. Either way, with tapering the US Dollar will rise due to the above mentioned traditional reaction.
  10. With an increase of Interest rates, next year as the rumors are, the banking sector will do better. increased interest rates always benefit the banks.
  11. A war over Taiwan and may be an attack on Israel by Iran or vis versa, will bring the oil and all commodity prices up big time. this will have a positive impact on oil prices and a negative impact on air travel, hotels and cruisers. 

    A review of 20 major geopolitical events dating all the way back to World War II showed stocks had fully recovered losses within an average of 47 trading days (10 weeks) after an average maximum drawdown of 5%, according to a CFRA study.

    An attack on Taiwan I consider more like of the level of the Iraq invasion or Pearl Harbor. It will send shockwaves through the market and reorganize priorities. China might be out of the window. It will have a huge impact. 
  12. In the case of a conflict with China, not small Iran or their proxies, the US Dollar will gain in value. Why is that? Shipping routs will be interrupted. Heavily needed Commodity Prices will rise. Oil prices will rise and so do chemical products. The US dollar would rise because it is the reserve currency of the world, and a hedge against uncertainty. Almost all petrochemical contracts as well as oil and other commodities are denominated in the US dollar. The sole exception to this rule is China. A rising Dollar will be anti inflationary.
  13. Contradicting this approach will be the wild card of the China Delta Covid. If there are more shut downs coming, more port closures and transportation chain bottle necks, inflation in the PPI and later in the CPI will increase. But the cocaine operation of the Feds (buying MBS and printing money) will continue and tapering will not start. Keep doing what we are doing, buy the dips. Then inflation will start to increase the pace, rate of inflation will rise. 

Conclusion

We have four levels. and each of them requires different actions
  1. Inflation and hence the start of tapering by the Feds.
  2. Cooling of the Money Velocity, M2V, and the increase of interest rates.
  3. The Delta Variance, the huge wild card!
  4. Chinas attack on Taiwan.

1. Inflation and hence the start of tapering by the Feds.

  • Go long USD, buy UUP ETF, US-Dollar ETF
  • Go Short AUD, Australia has a huge lockdown in place and its economy also is 20% depending on China. Shorting the Aussie looks good to me.
  • Find an Currency ETF you can trust, USD / AUD and go long, not the other way around.
  • Sell Bear Call Credit Spreads since the markets will rise slower and the strike might not be triggered. I chose Short Call 3 Standard Deviation OTM on the QQQ and SPY then Long Call for hedging $10 above that price. Maybe with tapering you could sell at 2nd standard deviation. I am not sure about this yet.

2. Cooling of the Money Velocity, M2V, and the increase of interest rates.

  • Go long USD, buy UUP ETF, US-Dollar ETF, rising interest rates are good for the USD.
  • Go Short AUD, Australia has a huge lockdown in place and its economy also is 20% depending on China. Shorting the Aussie looks good to me
  • Sell Call Bear Credit Spreads since the markets (QQQ, SPY, IWM) will rise slower and the strike might not be triggered. I chose Short Call 2 Standard Deviation OTM on the QQQ and SPY then Long Call for hedging $10 above that price. 
  • Buy Diagonal Put Debit Spreads. Go long PUT 1 standard Deviation OTM, 3 months DTE and to lower costs with buying the same PUT BUT with a shorter DTE (maybe 1 month) to cover costs, assuming that the strike will not be hit until in one month. Or Sell Calendar Spread 1 standard Deviation OTM.

3. The Delta Variance, the huge wild card!

If lockdowns are announced and the economic recovery seems to slow, stagflation, the Feds money will continue to flow. Inflation will rise and the Stock Market will rise. I will do the same as above but move my strikes for the credit spreads to the third Standard Deviation and reduce DTE from 45 days to 30.
  • Additionally to what is said you can do the following. Maybe the better choice in short term.
  • Buy a Call Diagonal Spreads with two different Strikes and Expiration Dates. Buy Call with a DTE, maybe one month. Buy it OTM, one StandDev.
    Sell a shorter term Call, maybe two weeks, further OTM, maybe 5$ for the QQQ to reduce costs. You expect the short position to expire worthless at date of Expiration and the long Call still continues in the money, ITM, for the next two weeks.
  • Buy Calendar Spreads with the same strike but two different Expiration Dates, maybe one month and 14 days. Buy it OTM with one month DTE, Sell a shorter term Call further OTM, same strike to reduce costs. You expect the short position to expire worthless at date of Expiration and the long Call still continues since the strike price is not yet hit. So be careful choosing the Strike!

4. Chinas attack on Taiwan

  • Go long Oil ETF, COG, CABOT OIL & GAS CORP; NRT, NORTH EUROPEAN OIL ROYALTY TRUST; 
  • Refining companies

  • Integrated Oil


  • Sell shares in Chinese ETFs or companies, they will instantly lose value. Be conscious about the spread. Be careful not to buy options, they might not be respected. You can google them. Go large caps.


  • Buy USD. It is said USD will rise and so inflation. A war with China there will be no doubt that they will pump money into the system. Inflation will rise and uncertainty of foreign countries will seek save harbor in the USD 
How to set up a Bear Call Spread will follow. I just cannot put this all into one article.
At least here is a guide line. Technicals are secondary but important.
Now we could look at the charts and look how to set up the trade since we know what to look for and we will listen to the news and watch the indicators to confirm our assumptions. Be careful at those times.
  • SPY, S&P500 market index ETF
  • DIA, Dow Jones Market Index, ETF
  • IMW, Small Cap Russel 2000, ETF
  • QQQ, NASDAQ, ETF
  • VIX, Volatility Index, reacts inverse to S&P500
  • AUM, AUD in USD Index
  • UUP, USD, ETF
  • AAPL Stocks as leading indicator for QQQ and SPY


Thursday, August 19, 2021

Update AMC 8/19/2021

After the week was starting out stronger for the Apes as before Thursday ended with a very low trading volume. I expected more.

While AMC was increasing the average daily trading we noticed today that the volume cut out at around 27%. The Option trading volume reached about 75% of the Monday and Tuesday volume and only 60% compared to last Thursday.

There were about 300,000 options changing hands today, 60% of them were calls and 40% Puts. These numbers do not mean that those options were bought. They were sold and bought. What ended up in the OPEN INTERESTS shows you if there are an increase of positioned buyers and sellers. Thus, even there is a 60% call option trading it could mean they were excessively sold.

I walked the Sweet Spot of the Market Maker up from 34-36 in the beginning of the week to 35-36. And today it looks like it moved again slightly UP to 35-37. This is where the MM want to be tomorrow when about 112,000 options with a total estimated value of $119,000,000.00 will expire. The payout for the MM would be around 5.5 to 6.5 million Dollars only.

That the closing price ended below the sweet spot at 33.84 might show in my opinion that The Put buyers were outnumbering the call buyers. It could also mean that buying calls do not have the expected effect on the share prices, remember, you are buying a derivative, a contract and not the shares themselves, and hence the Market Maker is only forced to buy the shares if he needs to cover. This would influence the price upwards. But also notice the apes buy their lottery ticket on a weekly base and hence the options expire on every Friday. The market maker still have the shares from the week before and hence they just take you contract and sell the shares instead of buying because they might have a shotload of them already. And why I am saying it I have the feeling that the price of AMC drops easier with a 1:1 volume or even less than that. I expected the price dropping this week below 30.

Thus, buying call option might only have less price influence. And that’s why I strongly believe all 122,000 options will expire worthless inside the sweet spot tomorrow. 35-37. If AMC closes below 35 it would show me the increasing strength of put buyers.


Please also consider, any call option you buy tomorrow for next week will not have any effects on the price unless it is a huge volume because 75,000 x 100 shares expire and can easily be covered at closing with the excess on long positions. That’s why the price might move into the sweet spot and that’s it.

Also consider that for every call you buy there MUST be someone who is selling that call to you. That means if you are totally convinced the price goes up and buy there is another trader with the total conviction that the price will go down and sells. The MM only provides the liquidity and let the contracts expire. And they will settle with the Clearing House.

Call to Put Ratio for this week is 0.564 and for next week so far 0.69. Put buyers buying with a longer time horizon.

  • At $45 we have a weak level of call options. About 5,000 contracts
  • At $40 we have the strongest level with about 30,000 contracts
  • At $38 another level with about 10,000 contracts.
  • At $37 another stronger level of about 13,000 contracts
  • At $36 about 5,000 contracts
  • The Puts are scattered about a wider field. We find weak support levels at 35-6,500, 34-5700, 33-5700, and 32-5000 contracts.

It will be much easier to break below 30 since after $32 everything is open. Also all combined put levels make about only 80% of the $40 Call level.

Featured Post

One Day before GDP Release. Whats up with the Qs?

The 28 May 365/385/315/295  QQQ  Iron Condor circles between 25% and 30% P/L. If it hits 30% today I will take it off. If it waits until tom...

Popular Post