Inflation is here to steal your money. The CPI is a lie. All your wages going down the drain. Inflation is a monetary creation, printing money to devaluate money, to steal it.
Friday, December 10, 2021
Tuesday, November 2, 2021
IWM Market Maker Sweet Spot Calculations
How do we get to the Sweet Spot
Derived from the amount of OPEN INTERESTS multiplied with 100 shares per contract times mid price gives us a good estimate what money is at stake and where the Market Maker will make the most money, or better said will lose the least! This is the spot where the market maker wants to be every Friday when there is Option Payday.
We notice that there are 1.56 Put Options for every Call option as open interests on the books. Traders are bracing for a down turn? We also see that there is a deviation between current price and sweet spot. IMO this might disappear by Friday. Market Makers will mobilizes every opportunity to get the price down. We can see that when the price came down to $224 and $226 that there are much less losses for the Market Makers. The difference is about 400 million Dollars!!
http://www.optioncrusader.com/uncategorized/iwm-market-maker-sweet-spot-calculations/
We made a mistake. Update on IWM Spread Trade
An update on IWM Call Spread. IWM reaches the frontline of defense threatening a breakthrough the all time high it reached in the beginning of March 2021 where it topped out at 234.53. Now what? Will it retread or advance?
We made a mistake.
Our calculations regarding entry level told us to enter the Spread at 248/253. But instead I entered the trade at 242/247. This is just above 1st Standard Deviation. Not good. Now I am trying to sell the wrong position for any bread crump I can get so that I can at least pay for commission and fees involved.
http://www.optioncrusader.com/trading-tactics/update-on-iwm-call-spread-november-01/

Thursday, October 28, 2021
Update on IWM Call Credit Spread, OCT/28/21
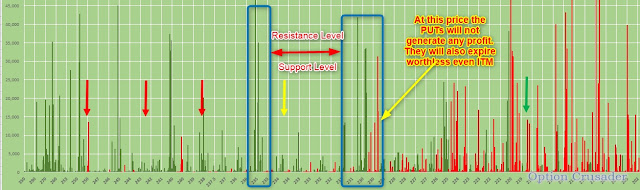
I was waiting for my two candles since Monday but the underlaying took a small retraction. Today on Thursday we saw a bullish engulfing. It was rejected at the 229-230 Resistance level. An area with over 100,000 Call and 50,000 Put options. If this level is broken the MM will have to hand out more money to the players. And this, they do not like. The Market Maker Sweet Spot is between $228 and $222. This is were I expect the price to settle for the end of this week. This is the zone where the MM make the most profit.
What do I expect tomorrow OCT 30th?

The US Economy is deteriorating further
The US Economy is deteriorating further. Now GDP estimates reach 0.2%!!! While the Bank of Canada cuts QE to damp inflation, Jerome Powell seems to be in inflation denial. What will he do?
Go Brandon, Go!

Monday, October 25, 2021
Here I try to explain why Inflation is always a problem that is created by the Central Banks and FOMC. It is not coming from “nature”. It is a manmade Inflation. Also, Shortages like Gasoline shortages are created by the regulatory and fiscal policies of the Government. You cancel all drilling activities on public land, you kill the Keystone XL pipeline, you terminate fracking, you overregulate natural gas extraction. These things were the first things the Biden Administration did when they came to power. They created shortages.
https://www.youtube.com/watch?v=aw4xygPswqo

Friday, October 22, 2021
Bear Call Credit Spread. Final Setup #5
Make sure that you understand all four previous blogs. They are fundamentally important to this trading tactics.
bear-call-credit-spread-histogram-3_20
Additions
I introduced the True Average and the Average True Range, ATR, into the equation. To calculate the True Range is easy, please look it up on the web. For EVERYTHING you need there is a exact equation somewhere in the EXCEL websites. Guaranteed. I am not providing this here. I just explain the concept in detail as a guideline.
Having the weekly TR you also can calculate the Average True Range, the ATR.
I calculate the ATR only off 4 weeks. That is the average of one month movement. It is not so much of a difference to the typical 14 day ATR but for me I want the empathize the immediate past. Do as you see fit.
These data are also collected from Yahoo and should already be part of the download.
We already calculated the Average Return per week, our Pos Avg Return, the worst case scenario of 100% uptrend! And we multiplied it with the occurrences in the data set, here 53.05% of the weeks. The amount of weeks that the underlaying is actually up by incorporating the downturns from the dataset. This is our mean average return.

Now that we have three averages, the worst case, the mean case, and the ATR I summed them all up and averaged them. This is what I call the BINGO NUMBER, in yellow circle. This is my STRIKE PRICE.
= AVERAGE(237.35 + 246.80 + 235.50)
= 239.89
So far the Bingo Number is slightly below the 2StdDev. So the Entry can be 2StdDev. If the Bingo number comes out above the 2StdDev take that as an entry.
What is the reason behind these calculations?
These calculations give us the best probable setup for our SHORT CALL Option that still makes sense for a better ROC. For the Return On Capital Ratio, the credit in relation to the collateral capital of the trade you have to come up with, we want to go as close as possible to the current price, "ATM", At The Money. This gives the highest CREDIT.
But also we want to stay as far away as possible from the current price of the underlaying, Out of The Money, OTM, to not hit the Strike. The calculated Bingo Number will be the STRIKE Price of the trade and brings Risk/Reward into balance.
All over all it stays 2 Standard Deviations away and hence has a trigger rate of about 10.7%. The ROC is about 6.5-7.5% depending on volatility and Yield Rate.

ROC Considerations.
The IWM is creating more ROC than the QQQ and the SPY. The two latter ones are close to 5% with this setup. The DIA (Dow Jones Industrial Average) runs under 2% with this setup and hence is completely excluded.
In our example we calculate ROC as
144 -(2 x 10.95) / 1,866.95 = 6.5%.
122.10 / 1,866.95 = 6.5%
Dont forget to substract 2 x FEES for the full turnaround.

With a 10% chance of getting hit and we reserve $50 for max losses per contract due to volatility and treasury yields (just close the trade at Strike Price) we have to substract this from the net ROC.
We might have
45 winners at net of $122.10, times 45 = $5,500
5 losers at 4 x $50.00, times 5 = $1,000
Net gain in one year of $4,500
The gain percentage would be 4,500 / 7,600 = 60%
If you can pull this off every hedge fund manager will hire you.
WHY?
Because your Kelly Criterion would be

Everything above 2.00 profit per Dollar is exceptional. And everything about 20% trade size is exceptional.
You are free to add any ZEROS to this game. We are not here to calculate hard numbers but to give examples and percentages.
Take a trade per week and do it 50 weeks a year! This will double your account.
Trade Entry
We enter the trade NOT to follow a trend up or down. We dont pick bottoms or tops! We try to get in, in the middle. For that reason we wait for two green (blue) candles and enter on the third day after 30 minutes of the Opening. We try to jump in on the top then, which occurs roughly at 0900-1000 NY Time. Let the rush go and try to sell at the top. Thats it! If that doesnt work out we enter anyways. Dont worry.
Why do we try to get in at the middle?
We know the swings in that stock and we calculated the deviations and when you look at the swing pattern and the technicals we see that after a few days up there are coming a few days down! These down days decay the Days To Expiration, Theta of the Option trade and hence it will have to come out from the bottom. We want to take advantage of this and further add to our odds. We want to own the bank in the casino. We are not here to play! Take a look at this image and you know what I mean.


Another reason for letting two green candles pass is that in an upward move CALLs become more expensive and hence give us a bigger credit. This is important. If you follow the stock you will notice that.
Definition of two Green Candles
- Two bull candles
- One bull candle and a gap n' crap with a doji
The third last candle was a bull candle and hence valid, the next candle was a red DOJI and it gapped open, which means there was a lot of after market trading and I count this as a bull candle for the purpose of this exercise. You want to sell into the uptrend. So we entered on the last candle.
Daily Charts

5 Minute Charts

Days to Expiration
We chose 30 DTE. I was considering 45 DTE since there is more money for a credit to get, true, but I decided for a monthly roll over and my calculations run on a 4 week base for some numbers. This is all up to ones liking.
Exit Trade
- Let the Trade expire and keep the CREDIT.
- If the trade runs against us close at Strike Price! Remember, you get the credit up front and when you are down by the total amount of your credit you are at Break Even only. This means at Strike your OPEN P/L should be negative CREDIT RECEIVED. You close and just give back the credit. There should not be any losses. Except commissions and fees.
- You might endure some losses due to volatility and yield rate. That amount might vary some from the BE.
Thursday, October 21, 2021
GDP Growth at a 0.5% estimate.
With an estimated GDP growth of only 0.5% for Q3 21 it tell me that the Bull Market is coming to an end. My Flags going on "Stay Flat" Yellow!! This would be a catastrophic drop of -3.7% from Q2. #Stagflation #GDP #Options Maybe it is time to Buy some PUTS in the S&P500. One year to expiration.
Inflation will getting worse! Too Much Money Printing.
STOP PRINTING MONEY!
Wednesday, October 20, 2021
Bear Call Credit Spread Histogram #4
Here is a visual of the Towers of Truth as I call them. The 1st Standard Deviation of a stock. With the QQQs we see different heights and with the IWM we see more balanced towers. The mean is the statistical mean and we see the chance of the stock to be above the mean or below the mean. The QQQs tend to the upside while the IWM is more ranging! Where do you want to be if you like neutral markets that are not going anywhere? IWM. Statistics tell you exactly what the probability is of being above the current market price and what is the probability of being below the current market price. You can also visualize what the potential losses are.
https://www.youtube.com/watch?v=Qj3TD9cCQAU

Tuesday, October 19, 2021
Bear Call Credit Spread Histogram #3
We are the Option Crusaders. We trade Credit Spreads. We crunch numbers.
Visit our Military Camp at: Http://OptionCrusader.com
Follow us on Twitter: AndrewLander13
Here is a visual of the Towers of Truth as I call them. The 1st Standard Deviation of a stock. With the QQQs we see different heights and with the IWM we see more balanced towers. The mean is the statistical mean and we see the chance of the stock to be above the mean or below the mean. The QQQs tend to the upside while the IWM is more ranging!

Where do you want to be if you like neutral markets that are not going anywhere? IWM. Statistics tell you exactly what the probability is of being above the current market price and what is the probability of being below the current market price. You can also visualize what the potential losses are.
https://www.youtube.com/watch?v=Qj3TD9cCQAU
Sunday, October 17, 2021
Bear Call Credit Spread Characteristics #2
As discussed before in an environment that is poised for a downturn in 6 or 12 month we want to have a trading strategy that has the following criteria. We want to make money when the stock market moves up moderately. We want to make money when the stock market moves sideways. We want to make money when the market goes down. We are the Option Crusaders. We trade Credit Spreads. We crunch numbers.
 |
The Bear Call Credit Spread Basic Thoughts #1
The basic thoughts on the Bear Call Credit Spread and in what economic environment we what to place this kind of trade. There will be more to follow. One step at a time.

Wednesday, October 13, 2021
2018 Interest Rate Hike 1
What is the difference between 2018 and 2021 and the coming Stock Market crash? There are similarities and there are huge implicating differences.

Tuesday, October 12, 2021
Sunday, October 10, 2021
GDP Now and STAGFLATION
GDP Now and STAGFLATION:

With the collection of data from the Atlanta FEDs we see a rapidly deteriorating US economy. The GDP forecast dropped from 6.1 annualized GDP growth to 1.3!! This is a major concerning development.
Saturday, October 9, 2021
The FOMC interest rate hikes in 2018 and now
The FOMC interest rate hikes in 2018 and now:
The Federal Reserve raised interest rates four times this year (2018). Earlier this month, at the Fed’s last meeting of 2018, Chairman Jerome Powell signaled that the central bank’s board of governors would likely issue fewer rate hikes next year, but investors were not appeased and the Dow Jones Industrial Average fell 352 points.The vast majority of losses have come since October, when the stock market, which was experiencing the longest bull-run in history, took a turn for the worst. The stock market is on pace for its worst December since 1931, but it also set record single-day gains Wednesday, when the Dow jumped by more than 1,000 points.
The stock market woes come despite signs that the general economy is still doing well — with record low unemployment, strong GDP growth and relatively low inflation.
Article extract from
https://www.pbs.org/newshour/economy/making-sense/6-factors-that-fueled-the-stock-market-dive-in-2018
We see similar things in the economy in 2021 except that the unemployment numbers are higher and 10 million open jobs to fill. Also the prices are extremely hot. Core inflation is surging above 5.2%.
Prices will inflate with a growing economy as we had under the Trump policies. We can see the production index of the PMI (red line) rising since 2015. Prices following suite.

AMC Update 10/09/2021
AMC Update 10/09/2021:

Hovering around the 38.50 and 37.50 level for the past 4
weeks AMC seem to break below the triangle and the 50% Fibonacci line. The trading
volume is also dramatically reduced it reached 29% of the current average
trading volume. This about 16% of the trading volume in August, which was at
176,000,000 shares a day.
I hope AMC will drop to 30 so that I can cash in my puts.
Wednesday, October 6, 2021
IWM Update 10/06/21
IWM Update 10/06/21: 
After the SPY dropped by 5% all commentators are in a tantrum. This will get worse. Why?
- The Feds keep pumping printed money into circulation, which immensely inflates the currency.
- We seem to be in the initial step of the “Blow Off Phase” of a trading cycle. Or the end of the “Denial” phase
Tuesday, October 5, 2021
Are we entering the BLOW OFF Phase?
Are we entering the BLOW OFF Phase?: Housing bubble. The excessive growth in the housing market is a concern.
Sunday, October 3, 2021
The Bear Call Credit Spread Strategy
Condition we need
As discussed before in an environment that is poised for a downturn in 6 or 12 month we want to have a trading strategy that has the following criteria.
- We want to make money when the stock market moves up moderately.
- We want to make money when the stock market moves sideways.
- We want to make money when the market goes down.
Specifics of the Setup
As outlined before the Call Spread is not that profitable as an Iron Condor and needs a little more capital but it has the following great characteristics.
- The upward risk can be determined and is limited by historical data. No market collapses to the upside and goes down at a constant rate. Just the opposite.
- The upward move of the underlaying is not a profit hindering development as long as the trend is at a moderate historical proven pace.
- The probability of being taken out can be calculated based on data sets. That level is around 5% in our method.
- This trade makes money even the stock does not move at all.
- This trade makes money when the price of the underlaying collapses. Great for an expected market crash. When all hell breaks lose you go like: YEAH, YEAH, Yummy Money!
The basic setup goes as follows.
We sell a call option at 2.5 Standard Deviation of the actual stock price.
We buy a call option further away than the first call for less money. Hence we end up with a credit. We are technically shorting the underlaying stock. We are "short".
Why are we buying another CALL when we are short? That second Call is the hedge. It limits our losses and winds down the collateral we have to come up with. We never do naked calls.

I personally do not like to call it a "Bear Call Credit Spread" but a credit spread or Call Spread because this spread makes money in a moderate uptrend, in a neutral market and in a bearish market. But not ONLY in a bearish market as the official name suggests!
Examples
Here is the IWM (Russel2000 ETF) as an example. Anyone who had bought this ETF in January would not have made any money. Why? Because the price today is the same as it was end of January, $222.

In these 8 months, THEORETICALLY, you could have sold every week a Call Spread Expiring 30 days thereafter. With a 5 years data set of weekly OHLC prices we know how much the IWM moves up and down. What is the volatility? What is the expected Gain per year in the IWM? What is the probability that the IWM moves to a certain level within 4 weeks? Is the IWM an up moving ETF or a slow moving ETF or what? We know all these data. And they are all publicly available. All of them. Ok, lets move on.
Basic math and Dollars of the Example
Assuming as the new package is set up now, we will sell every week this spread and wait for one month until it expires and so we can keep the CREDIT received upfront. 8 months to go. There is a weekly payday for the IWM. Every Friday is payday.
We can calculate 4 trades a month. We stick to the graph above. Just to use the easy numbers. You can run the details yourself.
- You need 4 x $1,850 to place a trade as collateral. This is $7,400, US Dollar in a month since this trades are rolling trades. 4 trades will be always on.
- Sell the spread for some money and never buy it back. Let it expire!! If you sold a PUT SPREAD it is more like selling insurances. You insure other traders against a huge downturn and guarantee them to buy their position for a written contract price, which will be executed if the market price is below that said contracts price.
- Selling a CALL SPREAD is more like selling lottery tickets with a certain (5%) chance of winning. Like in the Casino but you are the bank running the roulette table. After 4 weeks you let the ticket expire, like a lottery ticket. You buy it every week, no? I sell them every week to you. Run new numbers and sell a new Spread. Every week. Repeat.

- In 8 months you would have sold 8 months x 4 spreads. The credit received would have been 8 x 4 x ($162 - 7.95)= $5,000.
- Compared to the risk placed on the table, $7,400, the earnings would have been 67.6% or annualized 101.4%.
The four major ETFs
Before going deeply into the setup, lets take a look at the characteristics of the 4 major ETFs. Those are one of the most liquid ETFs on the market and hence your best chance to terminate your position in bad times.
The Qs and the IWM have the highest swing of the major ETFs. 2% and 1.8%. But when you put the days where the stock is down into calculation the ratio becomes more upward leaning for the Qs.
- For the QQQ (NASDAQ ETF) 1.1% up and 0.6% down on a weekly base.
- For the IWM (RUSSEL 2000 ETF)1.1% up and 0.97% down on a weekly base.
- The SPY (Standard and Poor 500 ETF) and the DIA (Dow Jones industrial Index ETF) run about the same. 0.85% up and 0.65% down. This is so when you incorporate the loosing days. If you invested in the S&P 500 or into the Dow Jones you would have made the same money.
- I love when the market doesnt move at all or when it crashes. I am naturally always a contrarian. Who would have thought!!!

Here is a visual of the Towers of Truth as I call them. The 1st Standard Deviation of a stock. With the QQQs we see different heights and with the IWM we see more balanced towers. The mean is the statistical mean and we see the chance of the stock to be above the mean or below the mean. The QQQs tend to the upside while the IWM is more ranging!
Where do you want to be if you like neutral markets that are not going anywhere? IWM. Statistics tell you exactly what the probability is of being above the current market price and what is the probability of being below the current market price. You can also visualize what the potential losses are.
As we saw from the graph above the swings are not very shallow but have some ripples, 2% wave swings. And the towers show you how balanced the stock is or how skewed it is. The QQQ is more skewed to the upside but similar volatile, wave ripples of 1.79%, as the IWM.

Winner and Loser Examples
Here is an example of a winner and a looser. But the trades happened in the past examined with current data. Hence the line of the Standard Deviation would be slightly different, maybe turning the looser into a winner.
We see a trade entry at the worst time when the stock is down at the bottom. And then it runs against you all month long. The upper turquoise line is 2.5 SD. Add $200 to it and that is your CUT OFF. Your Strike is being hit. That's why I say it is better to wait for two "green" candles in the daily charts and calculate the levels from there. You will avoid being hit too often.
And this is the QQQ, which we already know is leaning very much to the upside. Here probably wait for 4 green candles and in the 5th daily candle sell when seem fit at daily high.
For the IWM we only let two candles pass and decide in the third. But we can wait longer since we dont want a trend. The longer we wait and the stock is moving up the more probable it becomes that it will peak and retrace and the month is over. The Spread is dead.

Here is an example of a winner.

Here again is the SETUP
- Sell IWM Call Credit Spread at 2.5 / 3.5 SD every week
- Sell IWM only.
- Sell after 2 days of Green candles in a row. Sell in the third candle at daily high.
- Set Alarm when it hits the Strike Price at 2.5 SD
- Close it if the trade is losing $200
- Otherwise dont do anything and let the cat run dead.
Make yourself a nice spreadsheet where you have a simple data line up and input.

After Burner
I also put LONG CALL expectations together based on the same stats to see what the gain of long calls would be. Here we would go with the QQQs since they are the strongest in a trending market. But since the rumors are about that the Feds will be tapering soon we stay out of these things. The coming tapering will dive the market maybe by 25-30% and a follow up in interest rate hikes will crash the market. My numbers are 10 Year US Note Yield at 2.2% And commercial lending hitting pre-pandemic levels. BOOM and BUST. But here is the QQQ long call in an up trending market.
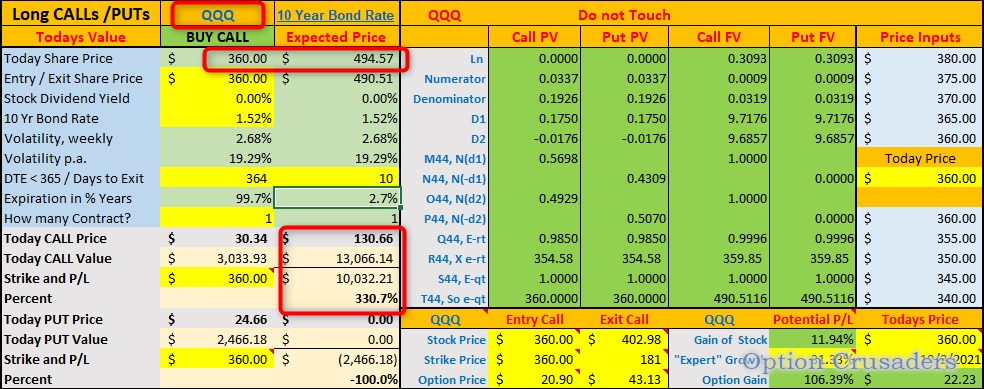
We can see that the QQQ might run up to $494 after one year according to the pricing from ETF . com and the data analysis from 5 years weekly data by me. Thus, buying a long call for QQQ with an expiration of 364 days and cashing it in during the last 10 days it is still alive, would make you pay $3,033 upfront for the contract and receiving a NET of $10,032 at selling. This is an astonishing 330% ROI!! You tripled your money. That's why nobody wants to taper and cool down the inflation since there is toooooo much money to be made. Who cares about inflation for the normal people? Nobody. Fact. And "normal" people care more about wearing the mask than how they get ripped off!
Thursday, September 30, 2021
Current Market Conditions and how to Trade Simple Options. Part 3/3
If you havent read the blog before do it now before trying to understand any of the following.
Read Theory and Resources first.
Basic Trade Characteristics to consider
- A Bear Call Credit Spread is a trade that consist of two trades. One short call and one long call. We sell a Call for a credit at a calculated level, the Short Call, and hedge this position with a Long Call further away from the short call price. We receive an instant credit for the selling of the call and pay a debit for the call we buy. The further out Call we buy is cheaper than the credit we receive for the first one. Thats why it is a credit spread.
- This is so to not selling a naked call, which would require a lot of collateral capital in your account. Our collateral is limited to the width of the spread times the number of contracts times 100 minus credit received, basically.
- The Bear in the name indicates that we want the market to go down, bearish, or stay ranging, neutral, or even with our setup having a moderate price increase.
- If you would sell a Bull Put Credit Spread at the same time you would create an Iron Condor. Even then having 4 legs in the trade, this trade would be cheaper! Why? Because one side would balance out the other side. Only one side can be loosing, the other side will win. The price cannot be in two location at the same time at closing in our universe. Thats why it only considers the excess of the collateral capital.
- An IC will decay over time and and lose value and hence makes you a profit. If it expires worthless the better for you.
An IC has to stay within a certain range and that would be fine with us since we also would calculate the standard deviations of the Put Spread. BUT, BUT, BUT in face of potential tapering a drop in the market might just shoot the Condor. And that would not be great. The condor will fall out of the sky. - For that reason we have to accommodate more collateral capital per trade and we will make less profit and, most importantly, a Call Spread can run negative until it expires in a market that moves up. Keep this in mind.
- This is from OptionsProfitCalculator.com.


- Also consider that with increasing volatility both, call option prices and put option prices go up and a spread sold in an low volatility environment might turn negative in a more volatile environment. Thus, do not try this option trade with very volatile stocks.
- Thats why best is to sell Call Spreads in an up moving market. You get more for your money and since already a few days of upwards move have happened the possibility of having a few more down turns during the life of the option increases, too. Good for us.
- Lets take a look at the collateral Capital you need to have in place. We chose an example of two contracts. Do how it fits your money management.
If you would do this as an IC it would get you three times the credit but as I said in these times of potential tapering I will play it safe.
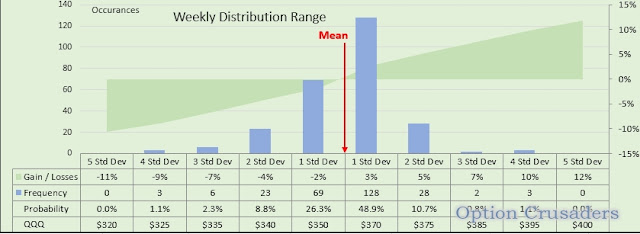
- Lets take a look at the distribution of the QQQ. You see how big the wins or losses are at certain StanDevs, how often they occur and what the probability is to be hit. This is all calculated as described in the first blog about it. Just more fancy looking in my world. If you love it you covert it into a science.


Now lets look at the table with the StanDev. Remember, first we filtered out all returns in the spread sheet GREATER THAN ZERO. This is the number in the red circle. This happens in 160 data sets out of 262 = 5 years weekly. This is the WORST CASE SCENARIO for an uptrend based on data from the past 5 years. Why I take 5 years only and not 10 or 20? I want the set to be more leaning to the current market behavior. So I exclude the other years.
Now that the average return of 1.89% happens only in 61.07% of all 262 weeks we have to multiply it with 61.07%. We get the mean Avg Return of 1.158%. The yellow circle. The first number tells you how the market would gain if there were NO negative days or weeks or mixes. The second number takes this into consideration and pretty much draws a straight line from one month to the next. This is like calculating the angle of a trendline.

- The AVG Median UP Trend is calculated per the weekly 1.158% gain
The AVG Worst Case UP Trend is calculated per weekly 1.896% gain
What we see right from the get go is that the worst case scenario is $12 above the Median Up Trend!!The next level up for a short entry is $380. And that is sitting between the 2nd Standard Deviation and the third!! That this will get hit is a probability of 10%.
- This is our SHORT CALL ENTRY at $380
The hedge for the LONG CALL will go $10 above at $390 and there you have it. - Bringing back the table with the P/L over time from OptionsProfitCalculator.com and see how to establish Stops. I keep my stop loss levels in my head. I dont like to put them out as a stiff snapping trap. Also options are derivatives of an underlaying and hence not follow straight lines as you will see. Anyway.
- Lets assume your Stop will calculate for a $200 loss in any trade. Your BOOK VALUE will be $180 and your MARKET VALUE would be -$380. You received a credit up front and losing that would not be a loss! You just pay it back. So your BE point would be at a MARKET VALUE of -$180.
In this image see the RED LINE in the SAND. You can see that a moderate increase in the Stock price will not make you lose the trade. If the price doesnt move at all you win, if the price of the underlaying falls, you win. This trade just does not like hasty spikes.
- Thats pretty much it.
Set these trades up on Tuesdays or Wednesdays and let them run until they expire. Do this weekly. Run a mental SL at minus $200 minus $180 and close it. It is a number game. Like the bank in a casino. - In OptionsProfitCalculator.com the details give this trade a 21% of success. In my calculations we have around 10%. Either way take the more conservative number of 20%.
This means, in our example here, you will lose 4 out of 20 trades. Lets calculate the 20% loss on 20 trades for 20 weeks for this stock alone. - You need about $8,000 to play this game, 4 weeks = 4 running trades
- you might win 16 trades at $180 = 2,880 minus fees
- you might lose 4 x $200 = $800
- Net could be 2,080 minus fees
- The P/L would be about 10% per trade but a trade only lasts 4 weeks each.
- Hence the annualized return would be around 116%
- If you choose to close the trade at 50% level you could write a rule that you are allowed to open a new trade if the Stock Price varies by 2% OR you have 2 days of green candles. Remember we do not chase a trend. We want a flat or bearish market!
- Another scenario to think about is that you could buy another long CALL at the BE line, minus $180, to accommodate for the losses if that might occur. If for whatever reason the stock retreats again and leaves your spread in the money, ITM, and your newly bought Call OTM, you can later also turn it into a credit spread. Thats the beauty of option trading.


Current Market Conditions and how to Trade Simple Options. Part 2/3
If you havent read the previous article yet you should do this before reading this one. Only if you understand the first article you will understand this setup here.
There should be three conditions for any trade in this environment.
- The risk of an huge market down turn is real and hence we do not want to be exposed to a down turn at all.
- The upside risk is less since up markets can be predicted with Statistical data and hence we can mitigate that risk by applying data for entry points and exits. A market will not explode entirely and collapse slowly. It is just the opposite.
- The market might trend sideways, trading up and down in a range or not moving at all. Our trade should make money in any of this cases as well.
What am I talking about? The magic wand for trading?
There are trade setups that do exactly what I just described as conditions. I am talking about Option Credit Spreads in general but here specifically of Bear Call Credit Spreads, or in short a Vertical Call or Call Spread with a credit. We sell first and then dont buy it back later. That's the fundamental idea. And if certain conditions appear we sell high first and buy it back later lower if P/L reaches 50%.
How do we mitigate if the trade goes against us?
You buy a call at the Red Line, Last Line of Defense. Or we let it expire for a loss and use The Bank of a Casino as a guideline. These trades are 80% successful.
Data collection and basic conception of wisdom
Here you must do some research on it. I urge you to do that since otherwise you will lose. Guaranteed. You swim with sharks. You intend to do Bird Watching in Lions country. You intend to serve tea and cup cakes in a battle field. Be prepared. I was just an electrician and I could learn it as a boomer. Here we go:
- Get HISTORICAL DATA for SPY and QQQ, which I am trading, both or simply one of them. At finance.yahoo.
Data of the past 5 years. weekly, download *.CSV - Load them into Excel. Create a column for RETURNS, calculate
- FILTER all data for average in gains greater than zero. Write down the percentage. Write down the number of weeks. Same for lesser than Zero. This will be our WORST CASE SCENARIO in an uptrend. The average of a weekly gain over 5 years and NO retracement!! The market only moves up scenario.
- Run DATA ANALYSIS and do a DESCRIPTIVE STATISTICS
- You will receive the mean out of your data input (RETURNS) aka as excepted return for professional investors.
- You will receive the STANDARD DEVIATION

- Now create 1. and 2. and 3. and 4. Standard deviation for the up side and down side


- This data goes into DATA ANALYSIS and HISTOGRAM. The INPUT RANGE will be RETURNS and BIN RANGE will be a vertical column of the standard deviations just created. BIN RANGE = INTERVALS. Chose an OUTPUT RANGE. It is BIN in the image. Then calculate Wins and losses and probabilities. See the histogram as graph below.

- Now you have all deviations and can calculate the price tag of the underlaying.

- The histogram will also give the percentage of probability for a certain price level to be reached. That is IMPORTANT!! Here the Histogram as a graph in Excel.
- And here the visualization of the weekly data curve with deviations and current price.

- There you have it. It took me about 1,000 hours to set it all up and calculate. Now it takes me 10 minutes to determine the trade parameters.
- I know I tend to over complicate things but I am meticulous in those things. You have to dive into this statistic thing deeply. The only way to understand the machines, the ALGOS, or just paddle with them. You cannot beat the market.
- To learn all about Options I went to Tastytrade DOT com. They have a huge site about options and all the concepts explained for free. Great stuff.
- Then I found and took a course at ITPM with Anton Kreil. Stock Trading Master Classes. ITPM DOT com. Here you learn to use Excel and Statistics. All of it. It helped me a lot. It made me create all those sheets. I am not associated with any of those brokers or educators. 95% are charlatans.


The next article will be about the setup.
Wednesday, September 29, 2021
AMC Update September, 29
The Army of the Apes seems to recede and long term speculators are taking the spot.
Beside that the average volume sunk below 50% from end of
August the daily trading is now only about 30% of that. 30 million daily trades
compared to 176 million average trades on August 25th. But at the
same time the put trading volume increased from 32% to 0.68%. It seems the
bears are gearing up. On Tuesday there were slightly more puts traded as calls.
The ratio was 1.02!!!
The option trading volume reaches about 330,000 contracts
and with it the IV Ranking dropped to 30% from its value end of August of 23%. I
want to say it is 7.4% now. This is the reason why my 37 PUT is still not in profit at $35 even it is ITM
The DTC, Day to Cover, also increased from 0.5 in August to
1.1 now. But this number IMO is understated due to the fact that DTC is
calculated from the average trading volume and this is in a steady decline. This
number is not correctly calculated in many sites.
“It is essential to remember that the short interest ratio and short interest
are not the same. Short interest measures the total number of shares that have
been sold short in the market”, Investopedia DOT com.
I think the real number is around 2 days since the daily trading volume never
reached the average volume since end of August and is in steady decline. And
the short float is pretty much steady.
With the share trading volume dropping to 39 million on Tuesday
and a short float of slightly above 97 million shares (a slight increase from
96 million) the Short Ratio stands at 248%!!! This means that there are about
2.5 times more short sellers in the market than the whole amount of traded
shares, which is 39 million
This is not the Army of Apes. Why is this?
The apes buy short term, one week and max 2 week options. We
see an increase in the Day To Expiration terms:
On the Put side
- 42 PUT 171 DTE
- 42 PUT 80 DTE
- 38 PUT 115 DTE
- 35 PUT 80 DTE
- 34 PUT 80 DTE
- A massive wall of 27 PUT 171 DTE with about 9,000 contracts
- 24 PUT 80 DTE with about 1,000 contracts, minor level
- 24 PUT 171 DTE
- 23 PUT 115 DTE
On the Call side
- 145 CALL 80 DTE with about 37,000 contract
- 145 CALL 115 DTE with about 95,000 contract
- 120 CALL 80 DTE
- 120 CALL 115 DTE
- 110 CALL 115 DTE
- 100 CALL 290 DTE
- 100 CALL 479 DTE
- 95 CALL 80 DTE
- 80 CALL 479 DTE
- 75 CALL 479 DTE
- 50 CALL 290 DTE
- 45 CALL 115 DTE
- 40 CALL 171 DTE
This shows me that the long term speculators are digging in knowingly that AMC will not rise before a major dip if at all. My most outstanding call trade is a 100 CALL expiring January 23, 2023 with 2,126 contracts. Price Tag 2.126 million Dolla. Well, good luck!

After all this being said the MM Sweet Spot stays the same for now and that AMC is trading below it indicates a lot of downward pressure. But we will see where AMC settles on Friday. I would not be surprise if AMC made a 4 dollar race to 39.
Subscribe to:
Comments (Atom)
Featured Post
One Day before GDP Release. Whats up with the Qs?
The 28 May 365/385/315/295 QQQ Iron Condor circles between 25% and 30% P/L. If it hits 30% today I will take it off. If it waits until tom...

Popular Post
-
An inverted Treasury yield curve is one of the most reliable leading indicators of an impending recession
-
When we take a look at the past 22 years we can see when ever the 10 Year Treasury Note hit a certain level and the yield curve reversed and...
-
 The truth hurts and offends . Most people haven't realized it yet but they have the most information and in excess of all information ...

